Plotting tables alsongside charts in R
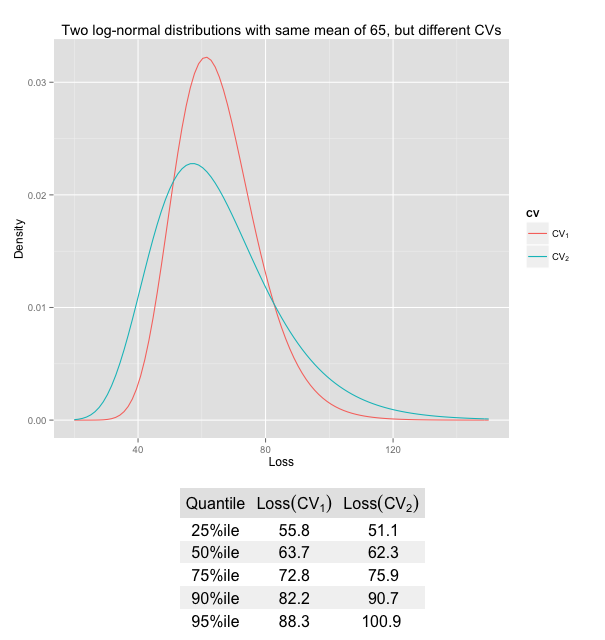
Occasionally I’d like to plot a table alongside a chart in R, e.g. to present summary statistics of the graph itself. Thanks to the gridExtra package this is quite straightforward. The function tableGrob creates a table like plot of a data frame, while arrangeGrob allows me to arrange ggplot2, lattice and grid graphical objects (short ‘grobs’, such as tableGrob) on a page.
Session Info
R version 3.2.1 (2015-06-18)
Platform: x86_64-apple-darwin13.4.0 (64-bit)
Running under: OS X 10.10.4 (Yosemite)

locale:
[1] en_GB.UTF-8/en_GB.UTF-8/en_GB.UTF-8/C/en_GB.UTF-8/en_GB.UTF-8

attached base packages:
[1] stats     graphics  grDevices utils     datasets  methods
[7] base

other attached packages:
[1] gridExtra_2.0.0 ggplot2_1.0.1

loaded via a namespace (and not attached):
 [1] Rcpp_0.11.6      digest_0.6.8     MASS_7.3-42
 [4] grid_3.2.1       plyr_1.8.3       gtable_0.1.2
 [7] magrittr_1.5     scales_0.2.5     stringi_0.5-5
[10] reshape2_1.4.1   proto_0.3-10     labeling_0.3
[13] tools_3.2.1      stringr_1.0.0    munsell_0.4.2
[16] colorspace_1.2-6
Citation
For attribution, please cite this work as:Markus Gesmann (Apr 14, 2015) Plotting tables alsongside charts in R. Retrieved from https://magesblog.com/post/2015-04-14-plotting-tables-alsongside-charts-in-r/
@misc{ 2015-plotting-tables-alsongside-charts-in-r,
author = { Markus Gesmann },
title = { Plotting tables alsongside charts in R },
url = { https://magesblog.com/post/2015-04-14-plotting-tables-alsongside-charts-in-r/ },
year = { 2015 }
updated = { Apr 14, 2015 }
}