googleVis version 0.5.8 released
We released googleVis version 0.5.8 on CRAN last week. The update is a maintenance release for the forthcoming release of R 3.2.0.
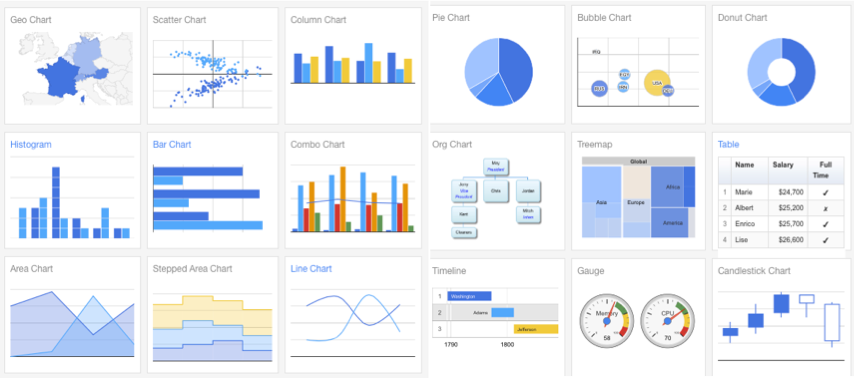 |
| Screen shot of some of the Google Charts |
New to googleVis? The package provides an interface between R and the Google Charts Tools, allowing you to create interactive web charts from R without uploading your data to Google. The charts are displayed by default via the R internal help browser.
Visit the examples of all googleVis charts on CRAN and review the vignettes.
Citation
For attribution, please cite this work as:Markus Gesmann (Jan 27, 2015) googleVis version 0.5.8 released. Retrieved from https://magesblog.com/post/2015-01-27-googlevis-version-058-released/
@misc{ 2015-googlevis-version-0.5.8-released,
author = { Markus Gesmann },
title = { googleVis version 0.5.8 released },
url = { https://magesblog.com/post/2015-01-27-googlevis-version-058-released/ },
year = { 2015 }
updated = { Jan 27, 2015 }
}