Visualising the seasonality of Atlantic windstorms
Last week Arthur Charpentier sketched out a Markov spatial process to generate hurricane trajectories. Here, I would like to take another look at the data Arthur used, but focus on its time component.
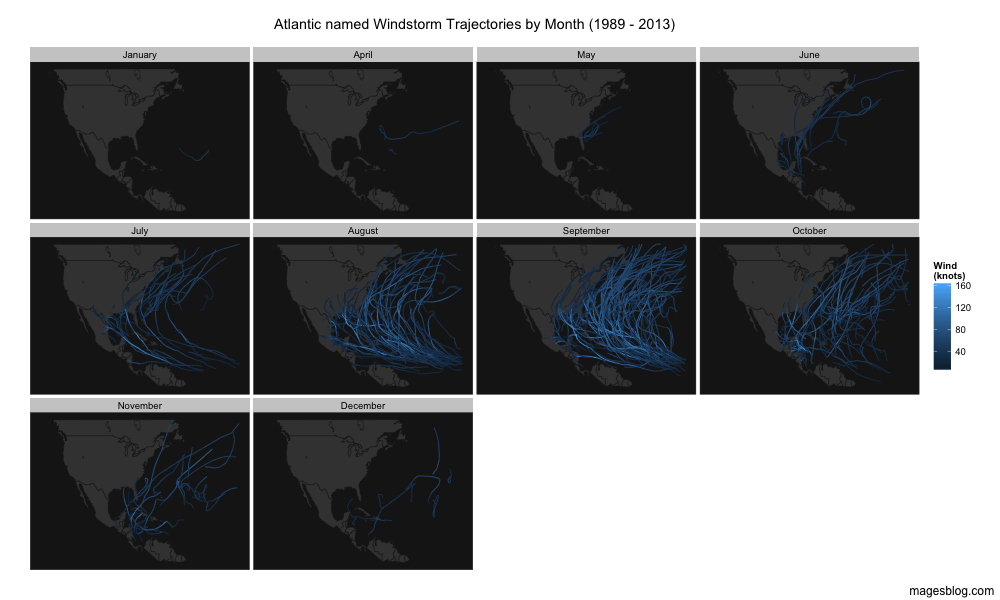
According to the Insurance Information Institute, a normal season, based on averages from 1980 to 2010, has 12 named storms, six hurricanes and three major hurricanes. The usual peak months of August and September passed without any major catastrophes this year, but the Atlantic hurricane season is not over yet.
So, let’s take a look at the data again, and here I will use code from Gaston Sanchez, who looked at windstorm data earlier.
I believe, I am using the same data as Arthur, but from a different source, which allows me to download it in one file (13.9MB). Using code from Gaston my chart of all named windstorms over the period of 1989 to 2013 looks like this.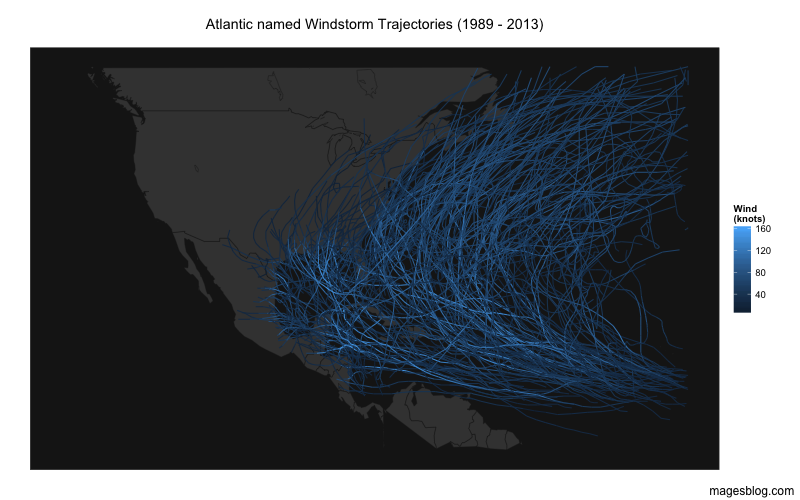
Perhaps there are other time components that effect the seasonality across years, such as La Niña? Plotting the years 1989 to 2013 certainly shows that there are years with more windstorm activity than others. Critical to the impact and cost of windstorms is if they make landfall or not. Hence, I add information on deaths and economic damages for major hurricanes over that period from Wikipedia.
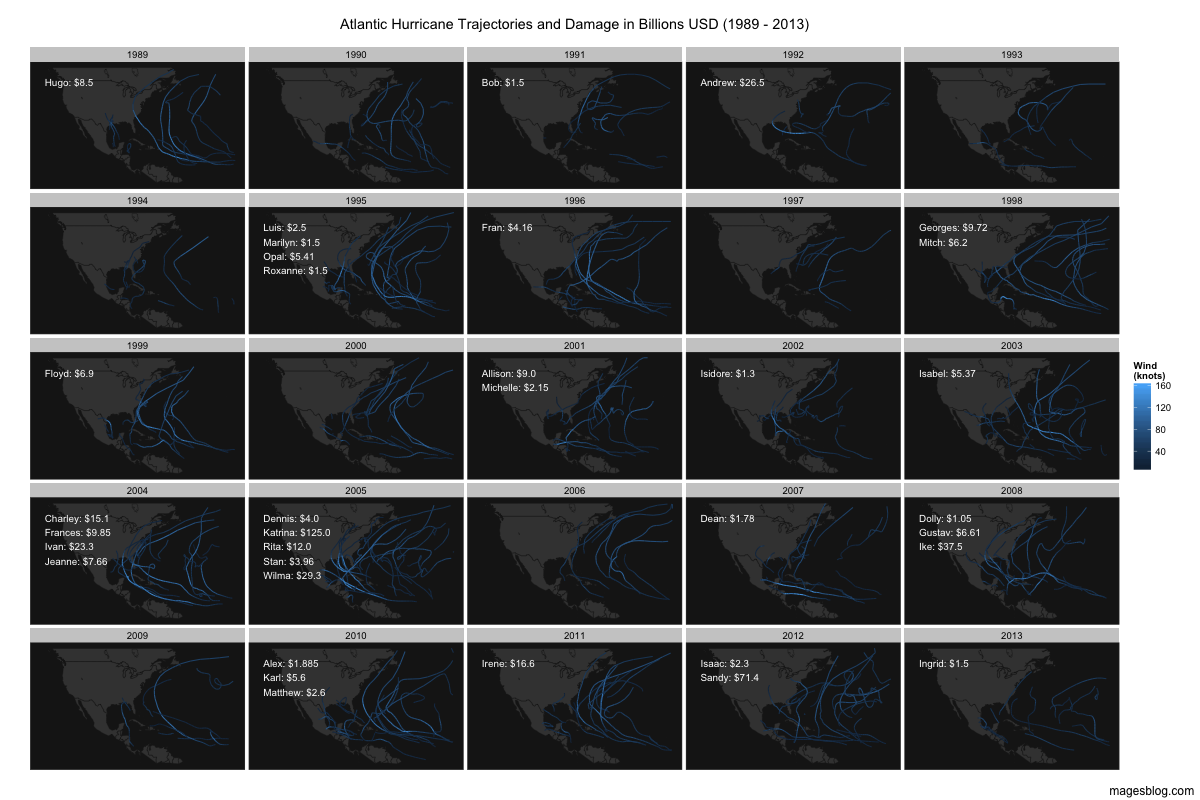
Although 1992 doesn’t show much windstorm activity, hurricane Andrew was the most expensive one to that date and changed the insurance industry significantly. Following hurricane Andrew insurance companies started to embrace catastrophe models.
The economic loss is a very poor proxy to the loss of lives. In 1998 Hurricane Mitch cost the lives of over 19,000, with most of them living in Honduras. The economic cost of USD 6.2bn looks small compared to the cost of Andrew six years earlier (USD 26.5bn).
R Code
Session Info
R version 3.1.1 (2014-07-10)
Platform: x86_64-apple-darwin13.1.0 (64-bit)

locale:
[1] en_GB.UTF-8/en_GB.UTF-8/en_GB.UTF-8/C/en_GB.UTF-8/en_GB.UTF-8

attached base packages:
[1] grid      stats     graphics  grDevices utils     datasets
[7] methods   base

other attached packages:
[1] XML_3.98-1.1     data.table_1.9.2 ggplot2_1.0.0
[4] maps_2.3-7

loaded via a namespace (and not attached):
 [1] colorspace_1.2-4 digest_0.6.4     gtable_0.1.2
 [4] labeling_0.3     MASS_7.3-33      munsell_0.4.2
 [7] plyr_1.8.1       proto_0.3-10     Rcpp_0.11.2
[10] reshape2_1.4     scales_0.2.4     stringr_0.6.2
[13] tools_3.1.1
Citation
For attribution, please cite this work as:Markus Gesmann (Oct 07, 2014) Visualising the seasonality of Atlantic windstorms. Retrieved from https://magesblog.com/post/2014-10-07-visualising-seasonality-of-atlantic/
@misc{ 2014-visualising-the-seasonality-of-atlantic-windstorms,
author = { Markus Gesmann },
title = { Visualising the seasonality of Atlantic windstorms },
url = { https://magesblog.com/post/2014-10-07-visualising-seasonality-of-atlantic/ },
year = { 2014 }
updated = { Oct 07, 2014 }
}