Interactive HTML presentation with R, googleVis, knitr, pandoc and slidy
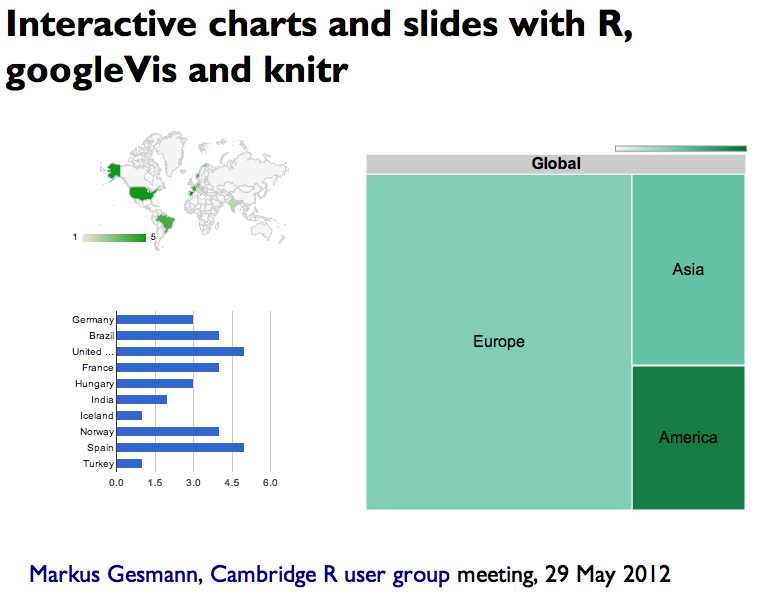
Tonight I will give a talk at the Cambridge R user group about googleVis. Following my good experience with knitr and RStudio to create interactive reports, I thought that I should try to create the slides in the same way as well.
Christopher Gandrud’s recent post reminded me of deck.js, a JavaScript library for interactive html slides, which I have used in the past, but as Christopher experienced, it is currently not that straightforward to use with R and knitr.
Thus, I decided to try slidy in combination with knitr and pandoc. And it worked nicely.
I used RStudio again to edit my Rmd-file and knitr to generate the Markdown md-file output. Following this I run pandoc on the command line to convert the md-file into a single slidy html-file:
pandoc -s -S -i -t slidy --mathjax Cambridge_R_googleVis_with_knitr_and_RStudio_May_2012.md -o Cambridge_R_googleVis_with_knitr_and_RStudio_May_2012.htmlEt volià, here is the result:
Addition (2 June 2012)
Oh boy, knitr and Markdown are hitting a nail. With slidify by Ramnath Vaidyanathan another project sprung up to ease the creation of web presentations.
Citation
For attribution, please cite this work as:Markus Gesmann (May 29, 2012) Interactive HTML presentation with R, googleVis, knitr, pandoc and slidy. Retrieved from https://magesblog.com/post/2012-05-29-interactive-html-presentation-with-r/
@misc{ 2012-interactive-html-presentation-with-r-googlevis-knitr-pandoc-and-slidy,
author = { Markus Gesmann },
title = { Interactive HTML presentation with R, googleVis, knitr, pandoc and slidy },
url = { https://magesblog.com/post/2012-05-29-interactive-html-presentation-with-r/ },
year = { 2012 }
updated = { May 29, 2012 }
}
