Hierarchical compartmental reserving models
Today, I will sketch out ideas from the Hierarchical Compartmental Models for Loss Reserving paper by Jake Morris, which was published in the summer of 2016 (Morris (2016)). Jake’s model is inspired by PK/PD models (pharmacokinetic/pharmacodynamic models) used in the pharmaceutical industry to describe the time course of effect intensity in response to administration of a drug dose.
The hierarchical compartmental model fits outstanding and paid claims simultaneously, combining ideas of Clark (2003), Quarg and Mack (2004), Miranda, Nielsen, and Verrall (2012), Guszcza (2008) and Zhang, Dukic, and Guszcza (2012). You find the first two models implemented in the ChainLadder package, the third in the DCL package and the fourth one in an earlier blog post of mine and as part of the brms package vignette.
Jake uses OpenBUGS (Lunn et al. (2000)) for the Bayesian examples in his paper. Thanks to Paul-Christian Bürkner’s brms package (Bürkner (2017)) I can run versions of Jake’s model in Stan (Stan Development Team (2017)) easily, as I will show in this post.
Note: Paul and Jake will be at the Stan workshop in London, following the Insurance Data Science conference, on 17 July 2018.
Hierarchical Compartmental Models
Similar to a PK/PD model, Jake describes the state-space process of claims developments with a set of ordinary differential equations (ODE), using \(EX=\) Exposure, \(OS=\) Outstanding claims, \(PD=\) Paid claims (these are the compartments):
\[ \begin{aligned} dEX/dt & = -k_{er} \cdot EX \\ dOS/dt & = k_{er} \cdot RLR \cdot EX - k_p \cdot OS \\ dPD/dt & = k_{p} \cdot RRF \cdot OS \end{aligned} \]
with initial conditions \(EX(0) = \Pi\) (ultimate earned premiums), \(OS(0)=0, PD(0)=0\).
The parameters describe:
- \(k_{er}\) the rate at which claim events occur and are subsequently reported to the insurer
- \(RLR\) the reported loss ratio
- \(RRF\) the reserve robustness factor, the proportion of outstanding claims that eventually are paid
- \(k_p\) the rate of payment, i.e. the rate at which outstanding claims are paid
Note, the product of \(RLR\) and \(RRF\) describes the ultimate loss ratio \(ULR =\) ultimate loss / premium, which is a key metric in insurance to assess performance and profitability.
Setting the parameters \(k_{er}=1.7\), \(RLR=0.8\), \(k_p=0.5\), \(RRF=0.95\) produces the following output.
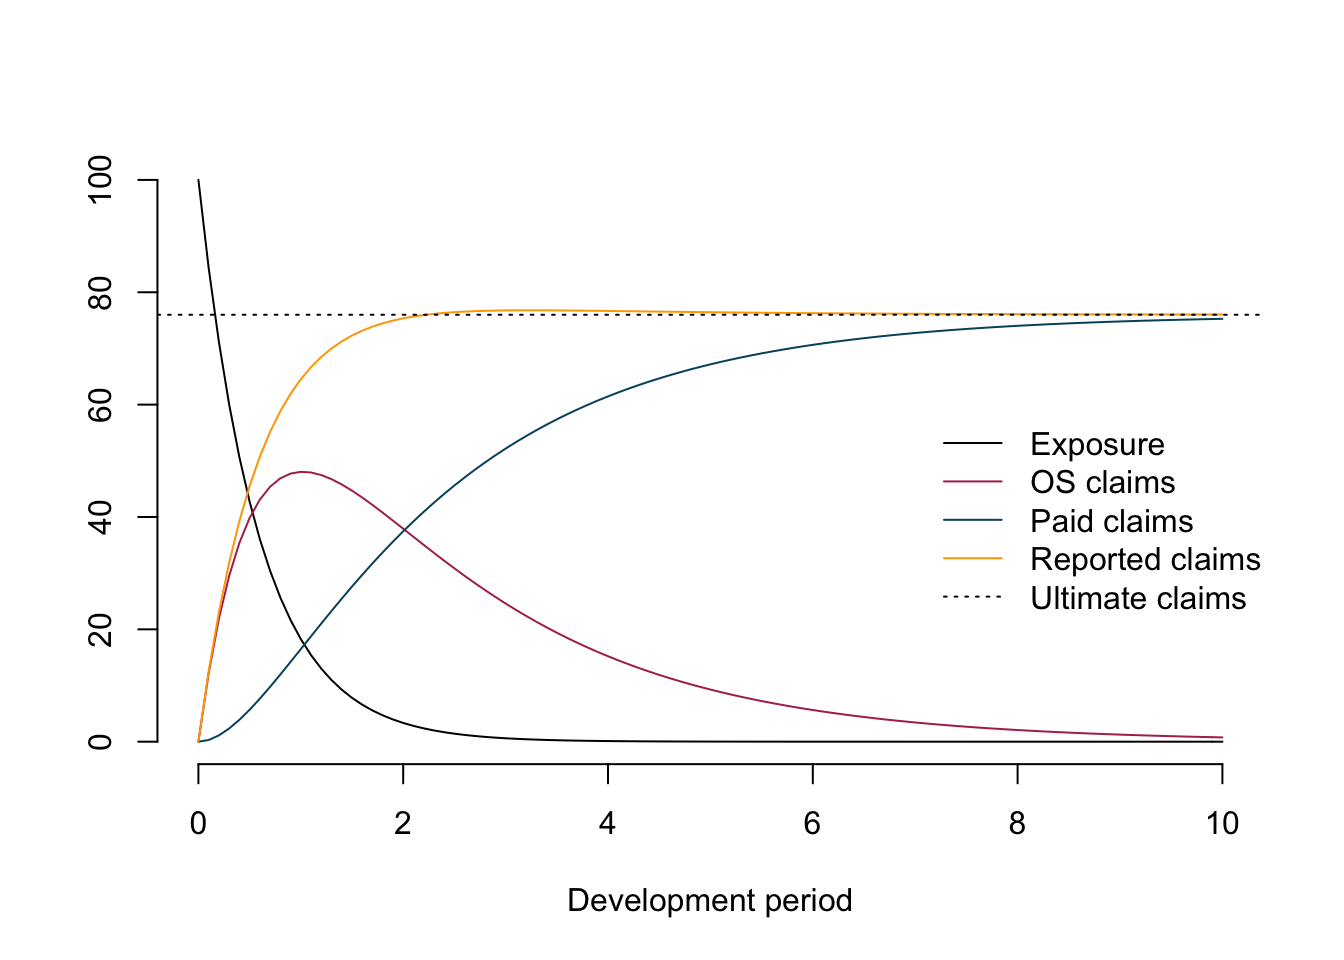
The chart illustrates nicely the different compartments (processes) for a policy over time.
The autonomous system of ODEs above can be solved analytically:
\[ \begin{aligned} EX(t) & = \Pi \cdot \exp(- k_{er} t) \\ OS(t) & = \frac{\Pi \cdot RLR \cdot k_{er}}{k_{er} - k_p} \cdot \left(\exp(-k_p t) - \exp(-k_{er} t)\right)\\ PD (t) & = \frac{\Pi \cdot RLR \cdot RRF}{k_{er} - k_p} \left( k_{er} \cdot (1 - \exp(-k_p t) - k_p \cdot (1 - \exp(-k_{er}t ) \right) \end{aligned} \]
In this post I will focus on the last two equations, as they describe the observable data of outstanding claims and cumulative paid claims over time. However, one could expand the model, e.g. to allow for different premium earning patterns.
Get example data
In his paper Jake uses data from the CAS Reserving Database, namely company 337 from the worker’s compensation file.
The following function downloads the data and reshapes it into a more useful format, very similar to the function used in an earlier post for Commercial Auto data.
library(data.table)
CASdata <- fread("http://www.casact.org/research/reserve_data/wkcomp_pos.csv")
createLossData2 <- function(CASdata, company_code){
compData <- CASdata[GRCODE==company_code,
c("EarnedPremDIR_D", "AccidentYear", "DevelopmentLag",
"IncurLoss_D", "CumPaidLoss_D", "BulkLoss_D")]
setnames(compData, names(compData),
c("premium", "accident_year", "dev",
"incurred_loss", "paid_loss", "bulk_loss"))
compData <- compData[, `:=`(
origin = accident_year - min(accident_year) + 1)]
compData0 <- compData[dev==1]
compData0 <- compData0[, `:=`(dev = 0, incurred_loss = 0,
paid_loss = 0, bulk_loss = 0)]
compData <- rbindlist(list(compData0, compData))
compData <- compData[, cal := origin + dev - 1][order(origin, dev)]
compData <- compData[, `:=`(
paid_train = ifelse(cal <= max(origin), paid_loss, NA),
paid_test = ifelse(cal > max(origin), paid_loss, NA),
os_train = ifelse(cal <= max(origin), incurred_loss - paid_loss, NA),
os_test = ifelse(cal > max(origin), incurred_loss - paid_loss, NA))]
traintest <- rbindlist(list(compData[cal <= max(origin)],
compData[cal > max(origin)]))
return(traintest)
}
lossData <- createLossData2(CASdata, company_code = 337)Let’s plot the data of outstanding and paid loss ratio against development years (\(t\)=dev) for the different accident years.
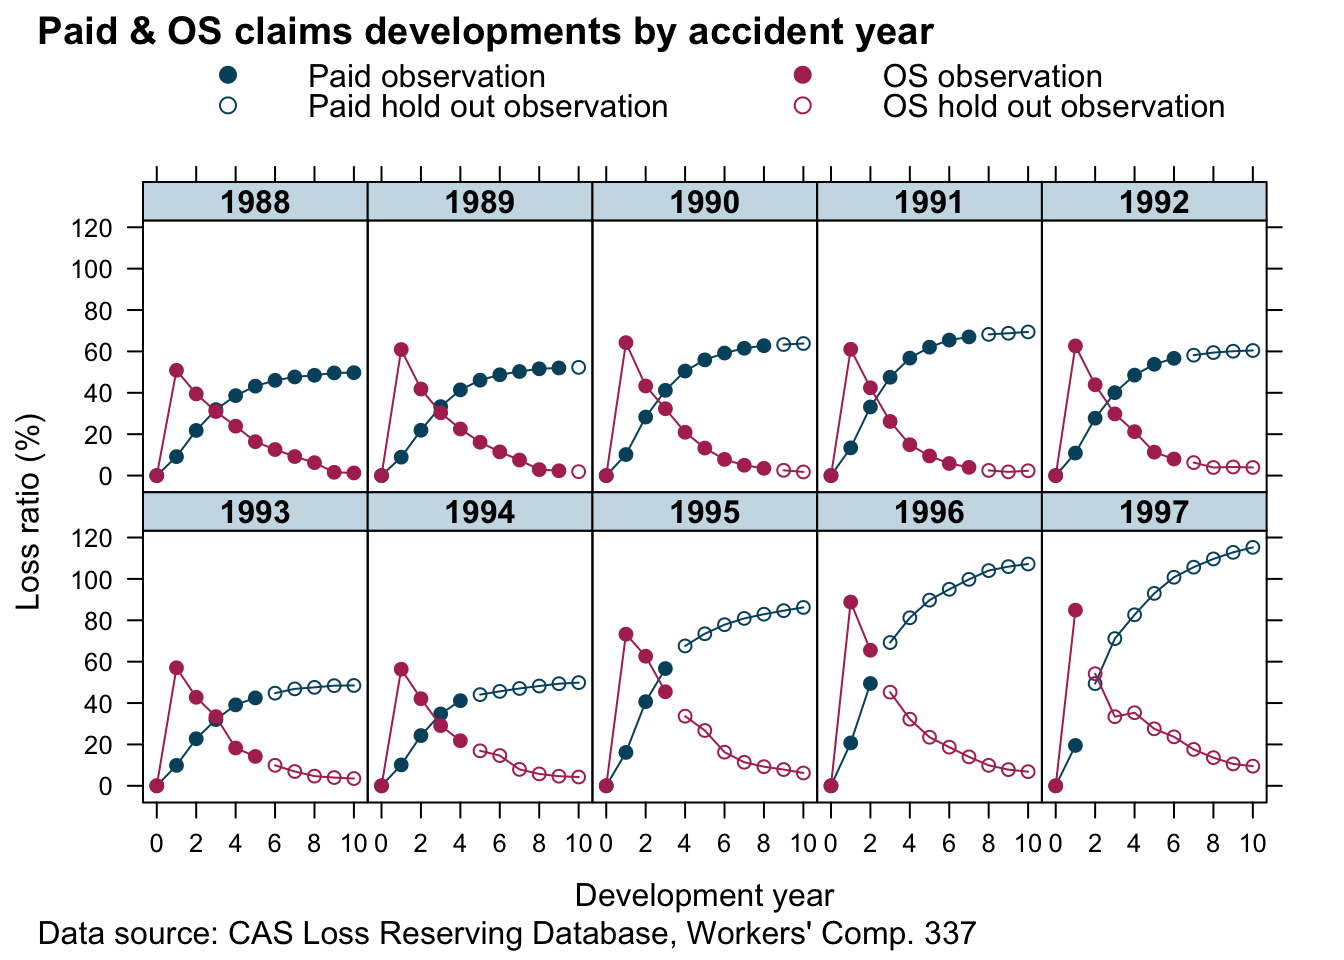
The data looks similar to the example output from our model above. That’s a good start.
Re-organising data
In order to fit the two curves simultaneously I use a little trick. I stack the paid and outstanding claims into a single column and add another indicator column (delta), which is either \(0\) for outstanding claims or \(1\) for paid claims. This turns the multivariate data back into a univariate set.
Additionally, I remove the artificial data for dev=0 again, add another column of the indicator variable as a factor (deltaf) and divide all measurement variables by the premium of the oldest accident year. The last step normalises the data and should make modelling a little easier as everything is in the ballpark of 1.
lossData0 <-
 rbindlist(
   list(lossData[, list(accident_year, dev, loss_train=os_train,
                        loss_test=os_test, delta=0, premium=premium)],
        lossData[,list(accident_year, dev,loss_train=paid_train,
                       loss_test=paid_test, delta=1, premium=premium)]
   ))[order(accident_year, dev)]

premind <- lossData0[accident_year==min(accident_year) & dev==min(dev) & delta==1, premium]
lossData0 <- lossData0[, `:=`(premium = premium/premind,
                              loss_train = loss_train/premind,
                              loss_test = loss_test/premind,
                              deltaf = factor(delta, labels = c("os", "paid")),
                              cal=accident_year + dev - 1)][dev>0]
Model fitting
Non-linear Least Squares
Before I build a complex Bayesian model I start with a simple non-linear least squares model. Or in other words, I believe the data is generated from a Normal distribution, with the mean described by an analytical function \(\mu(t)=f(t,\dots)\) and constant variance \(\sigma^2\).
\[ \begin{aligned} y(t) & \sim \mathcal{N}(\mu(t), \sigma^2) \\ \mu(t) & = f(t, \Pi, k_{er}, k_p, RLR, RRF, \delta)\\ & = \Pi \cdot [(1 - \delta) \frac{ RLR \cdot k_{er}}{k_{er} - k_p} \cdot \left(\exp(-k_p t) - \exp(-k_{er} t) \right) + \\ & \delta \frac{ RLR \cdot RRF}{k_{er} - k_p} \left( k_{er} \cdot (1 - \exp(-k_p t) - k_p \cdot (1 - \exp(-k_{er}t ) \right)]\\ \delta & = \begin{cases} 0 \mbox{ if } y \mbox{ is outstanding claim}\\ 1 \mbox{ if } y\mbox{ is paid claim} \end{cases} \end{aligned} \]
To ensure all parameters stay positive I will use the same approach as Jake does in this paper, that is I reparameterize using the logarithm of the parameters.
my.f <- function(t, premium, lk_er,  lk_p, lRLR, lRRF, delta){
  k_er <- exp(lk_er)
  k_p <- exp(lk_p)
  RLR <- exp(lRLR)
  RRF <- exp(lRRF)
  os <- (RLR * k_er / (k_er - k_p) * (exp(-k_p * t) - exp(-k_er * t)))
  paid <-  (RLR * RRF / (k_er - k_p) * (k_er * (1 - exp(-k_p * t)) -
                                        k_p * (1 - exp(-k_er * t))))
  return(premium * (os * (1 - delta) + paid * delta))
}
Using the nls function in R the model can be fitted quickly.
n1 <- nls(loss_train ~ my.f(dev, premium,
                            lk_er=lker, lk_p=lkp,
                            lRLR=lRLR, lRRF=lRRF, delta=delta),
          data=lossData0[cal<=max(accident_year)],
          start = c(lker = log(1.5), lRLR = log(1),
                    lkp = log(0.75), lRRF = log(0.75)))
n1
## Nonlinear regression model
## model: loss_train ~ my.f(dev, premium, lk_er = lker, lk_p = lkp, lRLR = lRLR, lRRF = lRRF, delta = delta)
## data: lossData0[cal <= max(accident_year)]
## lker lRLR lkp lRRF
## 0.8621 -0.1090 -0.8646 -0.4397
## residual sum-of-squares: 0.3505
##
## Number of iterations to convergence: 5
## Achieved convergence tolerance: 2.844e-06Let’s bring the coefficients back to the original scale:
n1par <- data.table(summary(n1)$coefficients)[, exp(Estimate + 0.5*`Std. Error`^2)]
names(n1par) <- c("ker", "RLR", "kp", "RRF")
n1par
## ker RLR kp RRF
## 2.4375609 0.8985600 0.4231800 0.6466241Assuming a constant variance across outstanding (delta=0) and paid claims (delta=1) doesn’t really make much sense, neither that the parameters RLR and RRF are the same across all accident years, which assumes the same ULR for all years: 57.8%.
Hierarchical non-linear model
To address the issues mentioned above, I allow for different variances depending on the compartment type (\(\sigma^2_{y[\delta]}\)) and allow the parameters RLR and RRF to vary across accident years.
\[ \begin{aligned} y(t) & \sim \mathcal{N}(f(t, \Pi, k_{er}, k_p, RLR_{[i]}, RRF_{[i]}), \sigma_{y[\delta]}^2) \\ \begin{pmatrix} RLR_{[i]} \\ RRF_{[i]}\end{pmatrix} & \sim \mathcal{N} \left( \begin{pmatrix} \mu_{RLR} \\ \mu_{RRF} \end{pmatrix}, \begin{pmatrix} \sigma_{RLR}^2 & 0 \\ 0 & \sigma_{RRF}^2 \end{pmatrix} \right) \end{aligned} \]
The parameters \(\mu_{RLR}, \mu_{RRF}\) describe the underlying means across all years \(i\).
With the preparation done, I can fit the hierarchical non-linear model using the nlme package, assuming that the parameters lRLR and lRRF vary across accident years (random effects), while I treat the parameters lker and lkp as fixed effects.
library(nlme)
m1 <- nlme(loss_train ~ my.f(dev, premium,
                             lk_er=lker, lk_p=lkp,
                             lRLR=lRLR, lRRF=lRRF, delta=delta),
           data=lossData0[cal<=max(accident_year)],
           fixed = lker + lRLR + lkp + lRRF ~ 1,
           random = pdDiag(lRLR + lRRF ~ 1),
           groups = ~ accident_year,
           weights = varIdent(form = ~ 1 | deltaf),
           start = c(lker = log(1.5), lRLR = log(1),
                     lkp = log(0.75), lRRF = log(0.75)),
           control=list(msMaxIter=10000, pnlsMaxIter=10000,
pnlsTol=0.4)) summary(m1)## Nonlinear mixed-effects model fit by maximum likelihood
## Model: loss_train ~ my.f(dev, premium, lk_er = lker, lk_p = lkp, lRLR = lRLR, lRRF = lRRF, delta = delta)
## Data: lossData0[cal <= max(accident_year)]
## AIC BIC logLik
## -524.4347 -502.8309 270.2174
##
## Random effects:
## Formula: list(lRLR ~ 1, lRRF ~ 1)
## Level: accident_year
## Structure: Diagonal
## lRLR lRRF Residual
## StdDev: 0.186949 0.1318405 0.03337559
##
## Variance function:
## Structure: Different standard deviations per stratum
## Formula: ~1 | deltaf
## Parameter estimates:
## os paid
## 1.0000000 0.1805809
## Fixed effects: lker + lRLR + lkp + lRRF ~ 1
## Value Std.Error DF t-value p-value
## lker 0.4102733 0.05624434 97 7.294481 0.0000
## lRLR 0.0225969 0.06751438 97 0.334698 0.7386
## lkp -0.7946096 0.03483365 97 -22.811551 0.0000
## lRRF -0.4049580 0.05558069 97 -7.285948 0.0000
## Correlation:
## lker lRLR lkp
## lRLR -0.375
## lkp -0.928 0.388
## lRRF 0.522 -0.282 -0.572
##
## Standardized Within-Group Residuals:
## Min Q1 Med Q3 Max
## -2.63652139 -0.52065601 0.03990089 0.61348869 2.01628548
##
## Number of Observations: 110
## Number of Groups: 10The parameters \(k_{er}\), \(\mu_{RLR}\), \(k_p\), \(\mu_{RRF}\) on the original scale are:
m1_fe <- data.table(summary(m1)$tTable)[, exp(Value + 0.5*`Std.Error`^2)]
names(m1_fe) <- c("ker", "RLR", "kp", "RRF")
m1_fe
## ker RLR kp RRF
## 1.5096155 1.0251880 0.4520317 0.6680359If you look at the p-Value of lRLR, we might as well assume \(\mu_{RLR}=1\).
The estimated ULR across accident years is 68.5%, and the median by accident year:
RLRRRF <- coef(m1)[,c(2,4)]
names(RLRRRF) <- c("RLR", "RRF")
round(exp(cbind(RLRRRF, ULR=apply(RLRRRF,1,sum))),3)
## RLR RRF ULR
## 1988 0.853 0.593 0.506
## 1989 0.925 0.577 0.534
## 1990 0.968 0.673 0.651
## 1991 0.910 0.798 0.727
## 1992 0.946 0.663 0.627
## 1993 0.899 0.562 0.505
## 1994 0.885 0.611 0.540
## 1995 1.232 0.724 0.892
## 1996 1.406 0.785 1.104
## 1997 1.382 0.734 1.014The parameters \(\sigma_{y[\delta]}\) are:
(sig_delta <- sapply(split(resid(m1), lossData0[cal<=max(accident_year)]$deltaf), sd))## os paid
## 0.032065014 0.005522208and \(\sigma_{RLR}\) and \(\sigma_{RRF}\) are:
VarCorr(m1)## accident_year = pdDiag(list(lRLR ~ 1,lRRF ~ 1))
## Variance StdDev
## lRLR 0.03494992 0.18694896
## lRRF 0.01738192 0.13184052
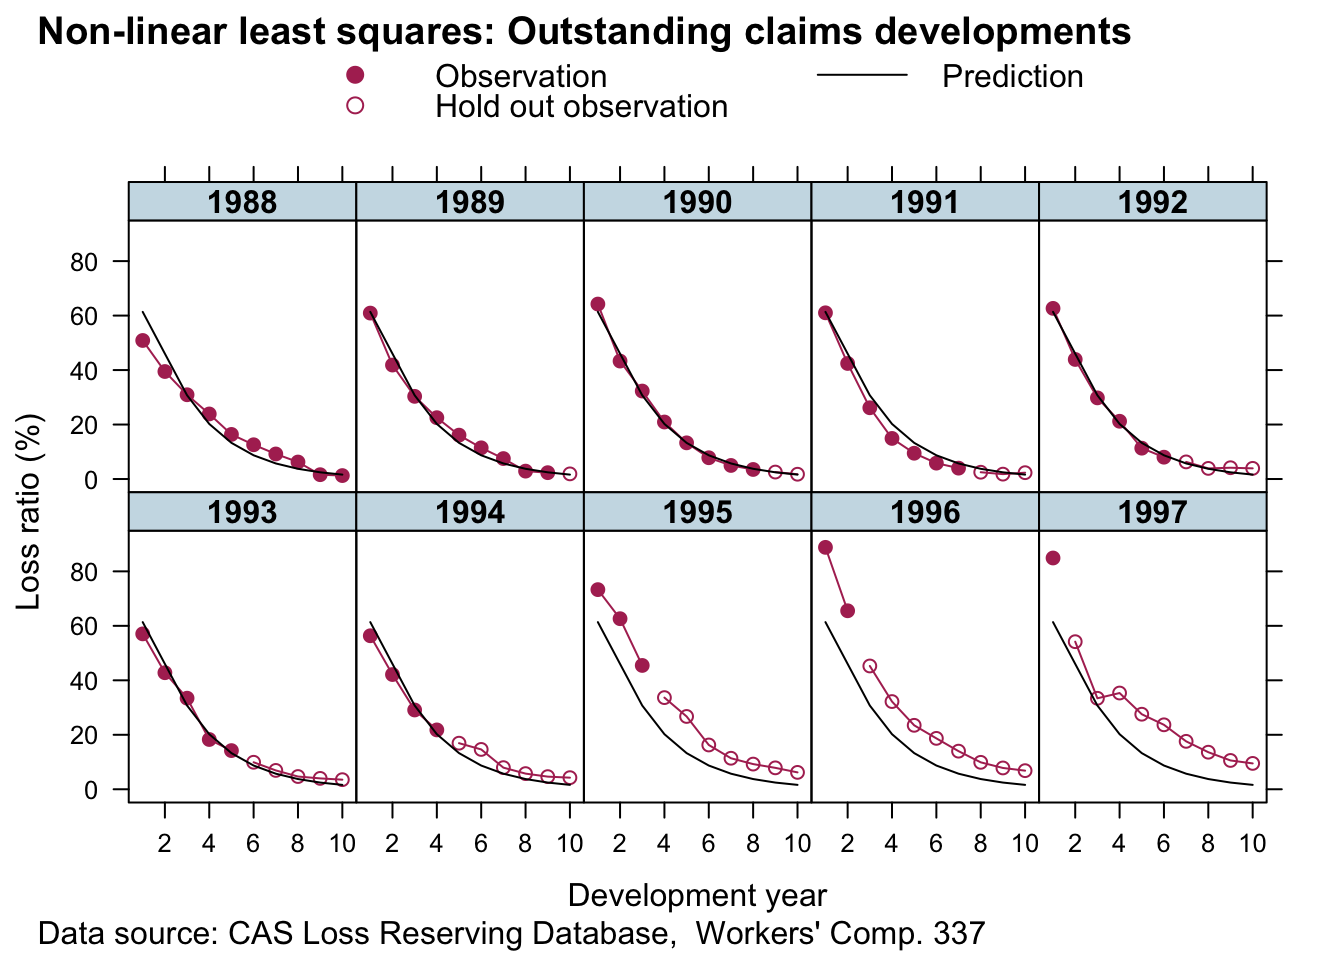
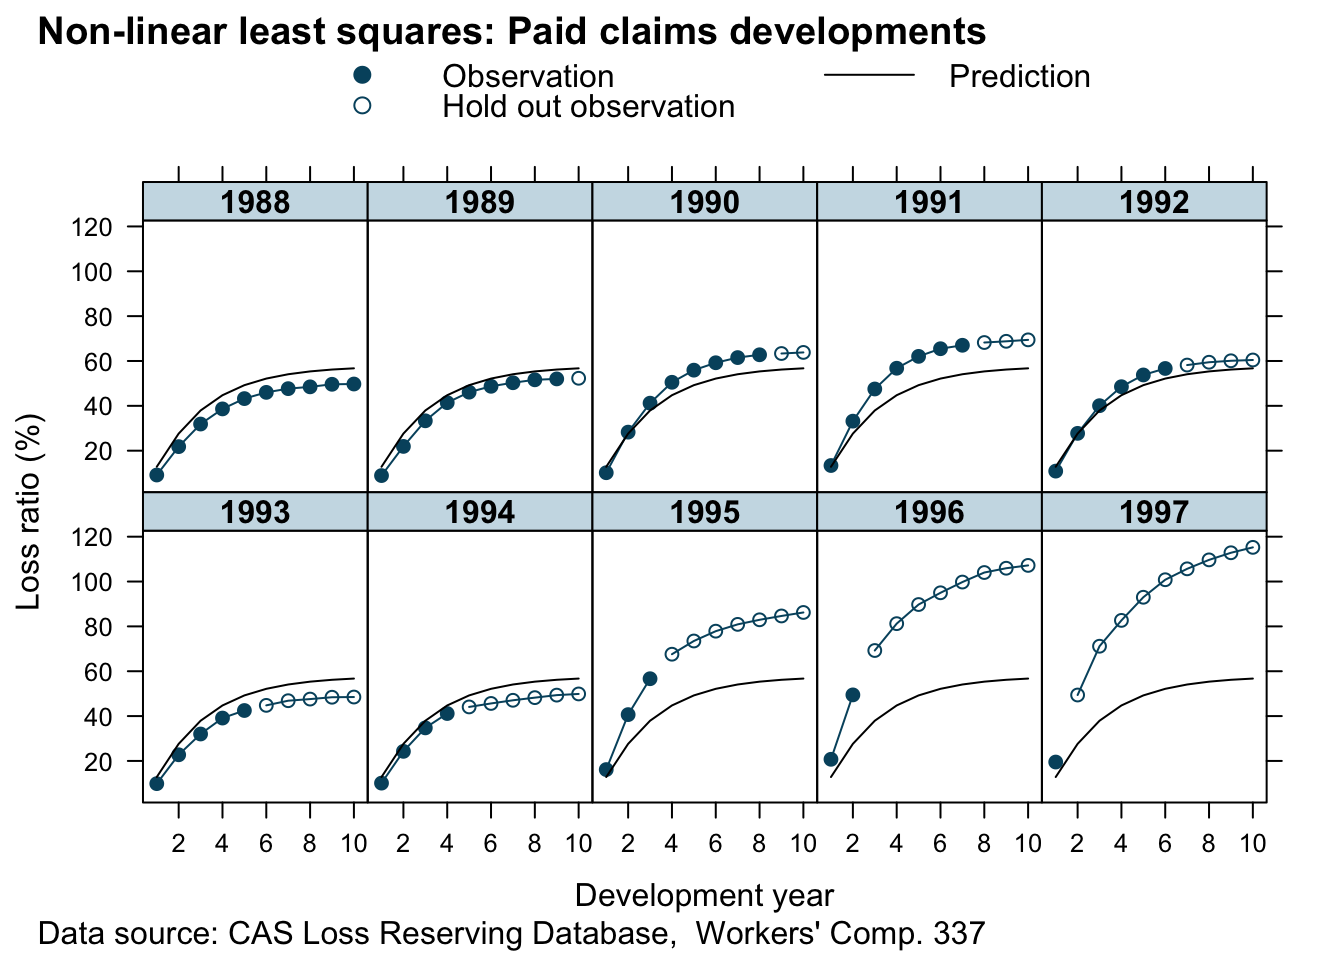
## Residual 0.00111393 0.03337559Let’s looks at the predictions:
Looks good. This is a huge improvement to the simple non-linear least squares model. For all years but 1997 (here we had only one data point) the predictions look pretty reasonable. The more data we have the more credibility will be given to it and shift parameters RLR and RRF away from the population mean.
Bayesian reserving models with Stan
We can fit the same model with Stan, which allows us to make different assumptions on the data generating distribution and specify the priors more flexibly. For example, I’d like to assume Gamma priors over my parameters, this will ensure the parameters are all positive and I don’t have to reparameterise them as I did above.
curve(dgamma(x, 4, 5), from = 0, 5, main="Gamma priors",
      xlab="", ylab="", bty="n")
curve(dgamma(x, 3, 2), add = TRUE, lty=3)
curve(dgamma(x, 3, 4), add=TRUE, lty=5)
text(x = c(0.1, 1.1, 2), y = c(0.8, 0.9, 0.4), labels = c("k_p", "RLR,\nRRF", "k_er"))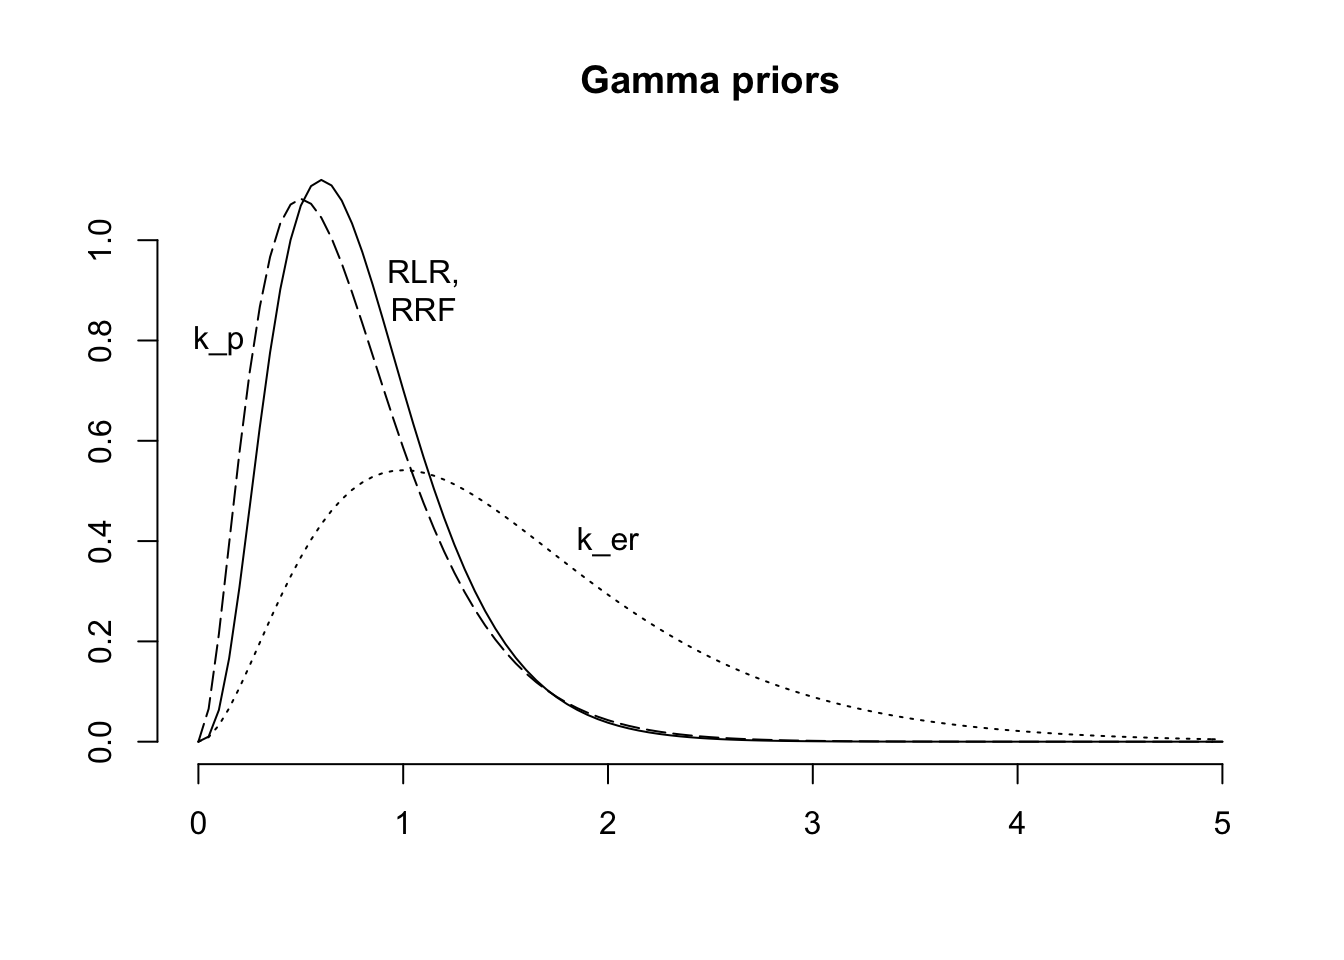
Next I specify my model with brm, which will not only generate the Stan code, but also run the model and collect all the results. I continue to use a Gaussian distribution, as it will allow me to compare the output of brm with nlme.
library(rstan)
library(brms)
rstan_options(auto_write = TRUE)
options(mc.cores = parallel::detectCores())

fml <-
  loss_train ~ premium * (
    (RLR*ker/(ker - kp) * (exp(-kp*dev) - exp(-ker*dev))) * (1 - delta) +
      (RLR*RRF/(ker - kp) * (ker *(1 - exp(-kp*dev)) - kp*(1 - exp(-ker*dev)))) * delta
    )
b1 <- brm(bf(fml,
             RLR ~ 1 + (1 | accident_year),
             RRF ~ 1 + (1 | accident_year),
             ker ~ 1,
             kp ~ 1,
             sigma ~ 0 + deltaf,
             nl = TRUE),
          data = lossData0[cal <= max(accident_year)],
          family = brmsfamily("gaussian", link_sigma = "log"),
          prior = c(prior(gamma(4, 5), nlpar = "RLR", lb=0),
                    prior(gamma(4, 5), nlpar = "RRF", lb=0),
                    prior(gamma(3, 2), nlpar = "ker", lb=0),
                    prior(gamma(3, 4), nlpar = "kp", lb=0)),
          control = list(adapt_delta = 0.999, max_treedepth=15),
seed = 1234, iter = 1000)b1## Family: gaussian
## Links: mu = identity; sigma = log
## Formula: loss_train ~ premium * ((RLR * ker/(ker - kp) * (exp(-kp * dev) - exp(-ker * dev))) * (1 - delta) + (RLR * RRF/(ker - kp) * (ker * (1 - exp(-kp * dev)) - kp * (1 - exp(-ker * dev)))) * delta)
## RLR ~ 1 + (1 | accident_year)
## RRF ~ 1 + (1 | accident_year)
## ker ~ 1
## kp ~ 1
## sigma ~ 0 + deltaf
## Data: lossData0[cal <= max(accident_year)] (Number of observations: 110)
## Samples: 4 chains, each with iter = 1000; warmup = 500; thin = 1;
## total post-warmup samples = 2000
##
## Group-Level Effects:
## ~accident_year (Number of levels: 10)
## Estimate Est.Error l-95% CI u-95% CI Rhat Bulk_ESS Tail_ESS
## sd(RLR_Intercept) 0.25 0.08 0.14 0.45 1.01 630 954
## sd(RRF_Intercept) 0.11 0.04 0.06 0.20 1.01 822 1178
##
## Population-Level Effects:
## Estimate Est.Error l-95% CI u-95% CI Rhat Bulk_ESS Tail_ESS
## RLR_Intercept 1.02 0.09 0.83 1.19 1.01 522 573
## RRF_Intercept 0.67 0.04 0.59 0.76 1.01 639 738
## ker_Intercept 1.55 0.11 1.37 1.78 1.00 1021 1115
## kp_Intercept 0.45 0.02 0.42 0.49 1.01 1144 958
## sigma_deltafos -3.38 0.12 -3.61 -3.15 1.00 1301 1395
## sigma_deltafpaid -5.07 0.13 -5.30 -4.80 1.00 1127 1026
##
## Samples were drawn using sampling(NUTS). For each parameter, Bulk_ESS
## and Tail_ESS are effective sample size measures, and Rhat is the potential
## scale reduction factor on split chains (at convergence, Rhat = 1).This looks similar to the output of nlme. Note, the link function for sigma was log, so to compare the output with nlme I have to transform it back to the original scale:
library(rstan)
X <- extract(b1$fit)
(sig_delta_brm <- apply(X$b_sigma, 2, function(x) exp(mean(x)+0.5*var(x))))
## [1] 0.03413337 0.00632486Again, that’s pretty similar.
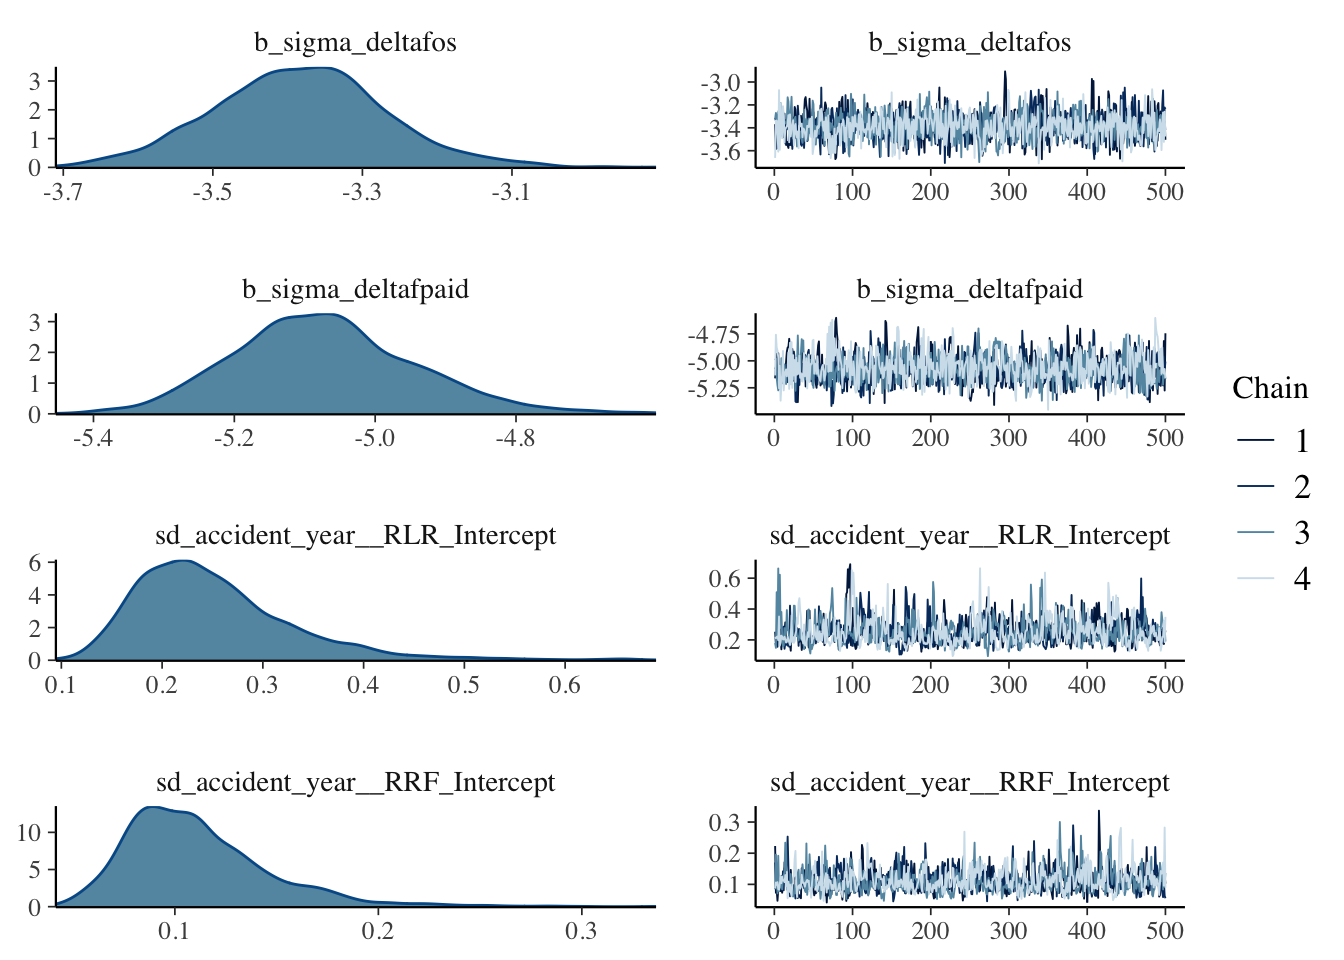
The simulations are well behaved as well:
plot(b1, N = 4, ask = FALSE)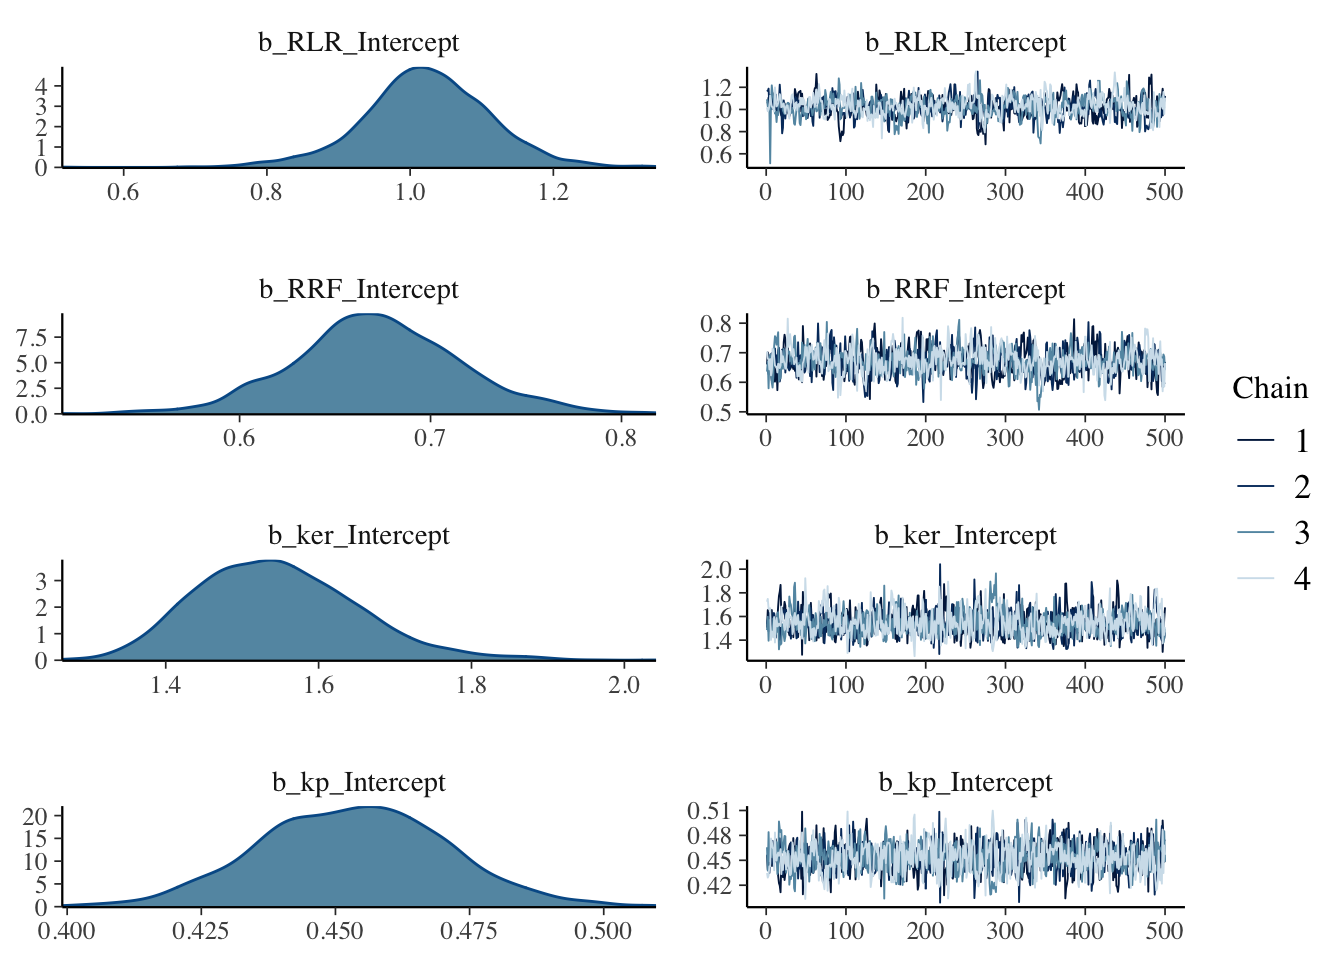
Next I want to compare the estimated accident year ULRs with the ‘population’ level ULR.
RLR <- sweep(X$r_1_RLR_1, 1, X$b_RLR, "+")
RRF <- sweep(X$r_2_RRF_1, 1, X$b_RRF, "+")
ULR <- t(apply(RLR * RRF, 2, quantile, c(0.025, 0.5, 0.975)))
matplot(unique(lossData0$accident_year), ULR*100,
        t="l", ylim=c(0, 150), lty=1, col=c(1,2,4), bty="n",
        ylab="Projected ULR (%)", xlab="Accident year")
legend("topleft", legend = c("2.5%ile","50%ile", "97.5%ile"),
       lty=1, col=c(1,2,4), bty="n")
baseULR <- X$b_RLR * X$b_RRF
abline(h=quantile(baseULR, 0.025)*100, col=1, lty=3)
abline(h=median(baseULR)*100, col=2, lty=3)
abline(h=quantile(baseULR, 0.975)*100, col=4, lty=3)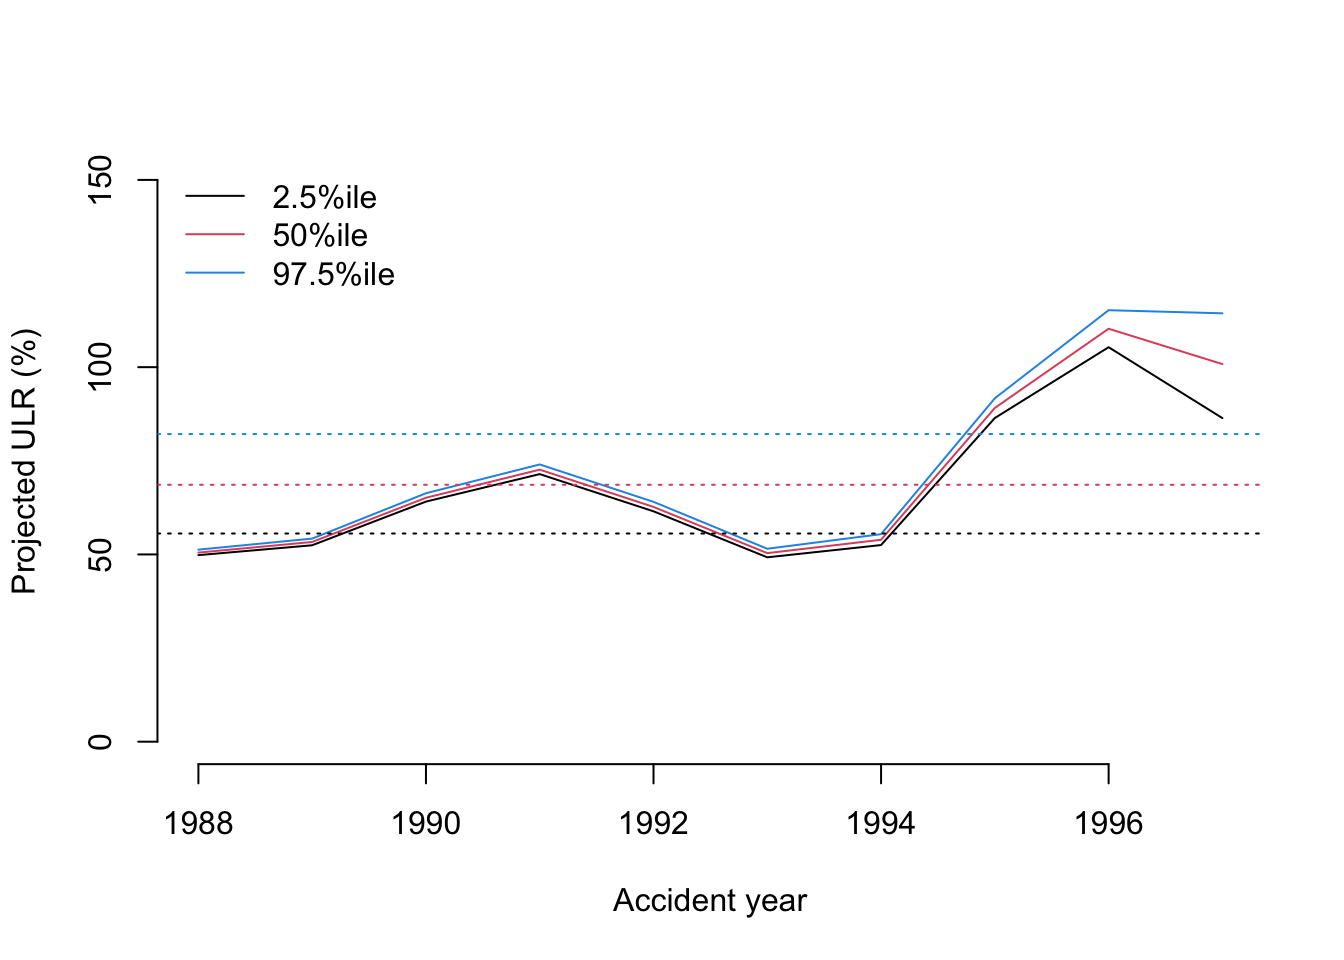
That’s interesting, as the softening casualty market (increasing loss ratio) of the late 1990’s is very visible. From this plot you would assume 1996 was the worst year and perhaps an outlier. However, as the data shows, 1997 was even less profitable than 1996.
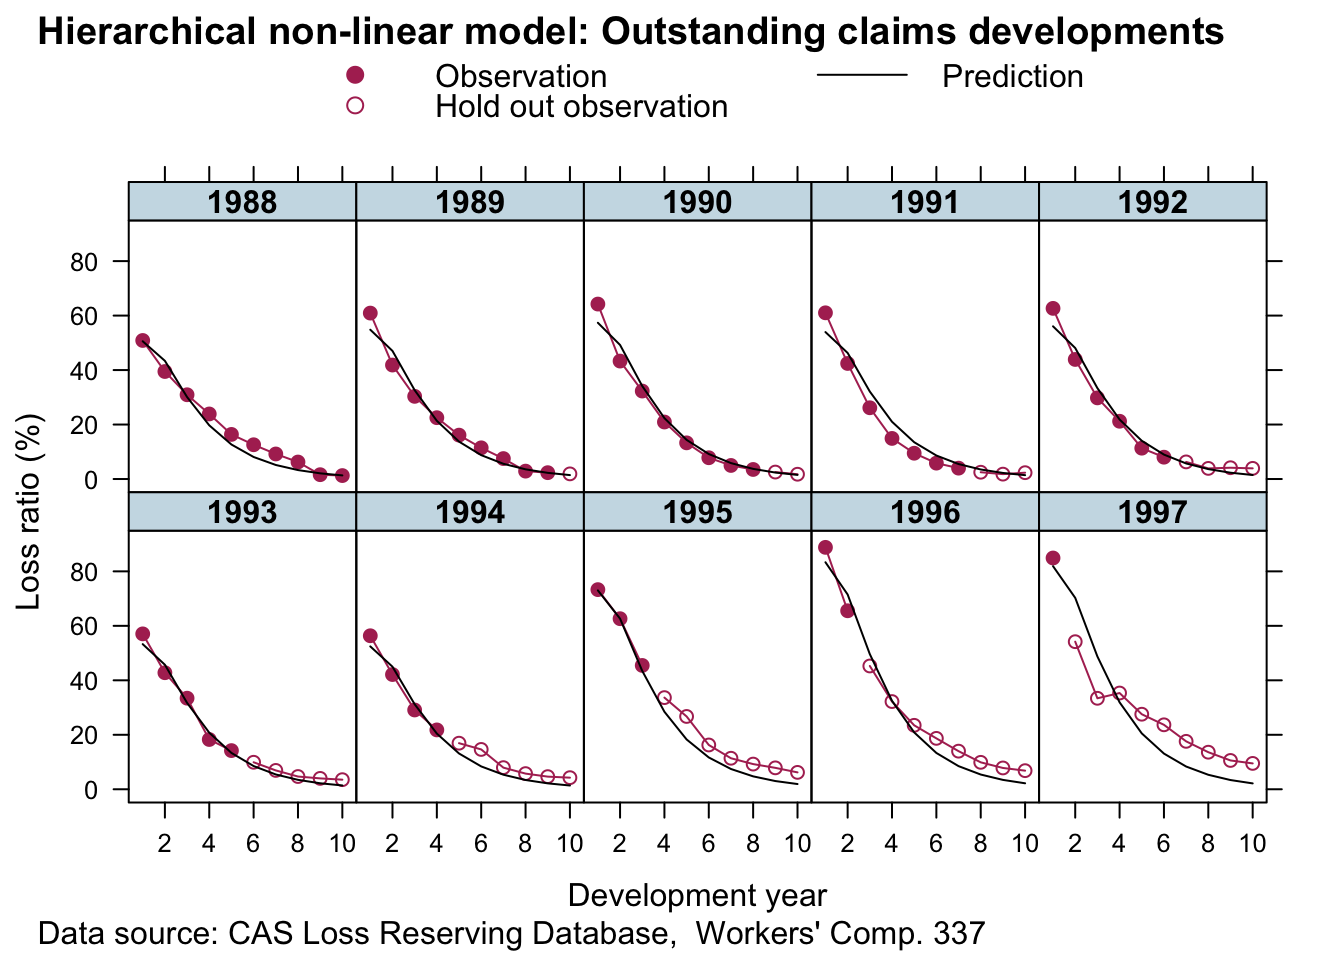
Let’s plot the predictions of the model, with the plotDevBananas function from an earlier post.
predClaimsPred <- predict(b1, newdata = lossData0, method="predict")
plotDevBananas(`Q2.5`/premium*100 + `Q97.5`/premium*100 +
                 Estimate/premium*100 + loss_train/premium*100 +
                 loss_test/premium*100 ~
                 dev | factor(accident_year), ylim=c(0, 100),
               data=cbind(lossData0, predClaimsPred)[delta==0],
               main="Outstanding claims developments",
               ylab="Outstanding loss ratio (%)")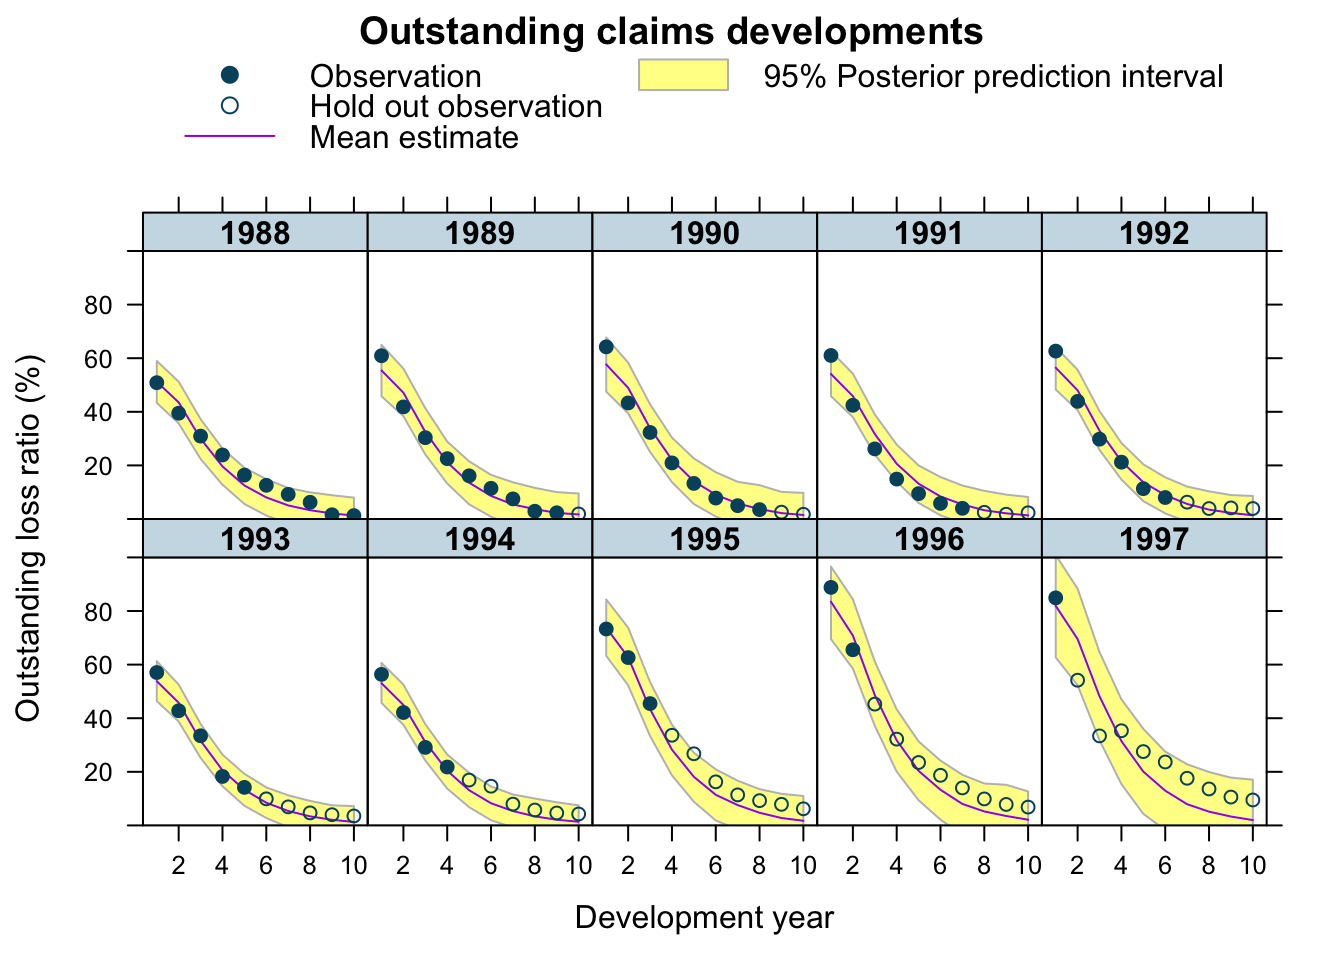
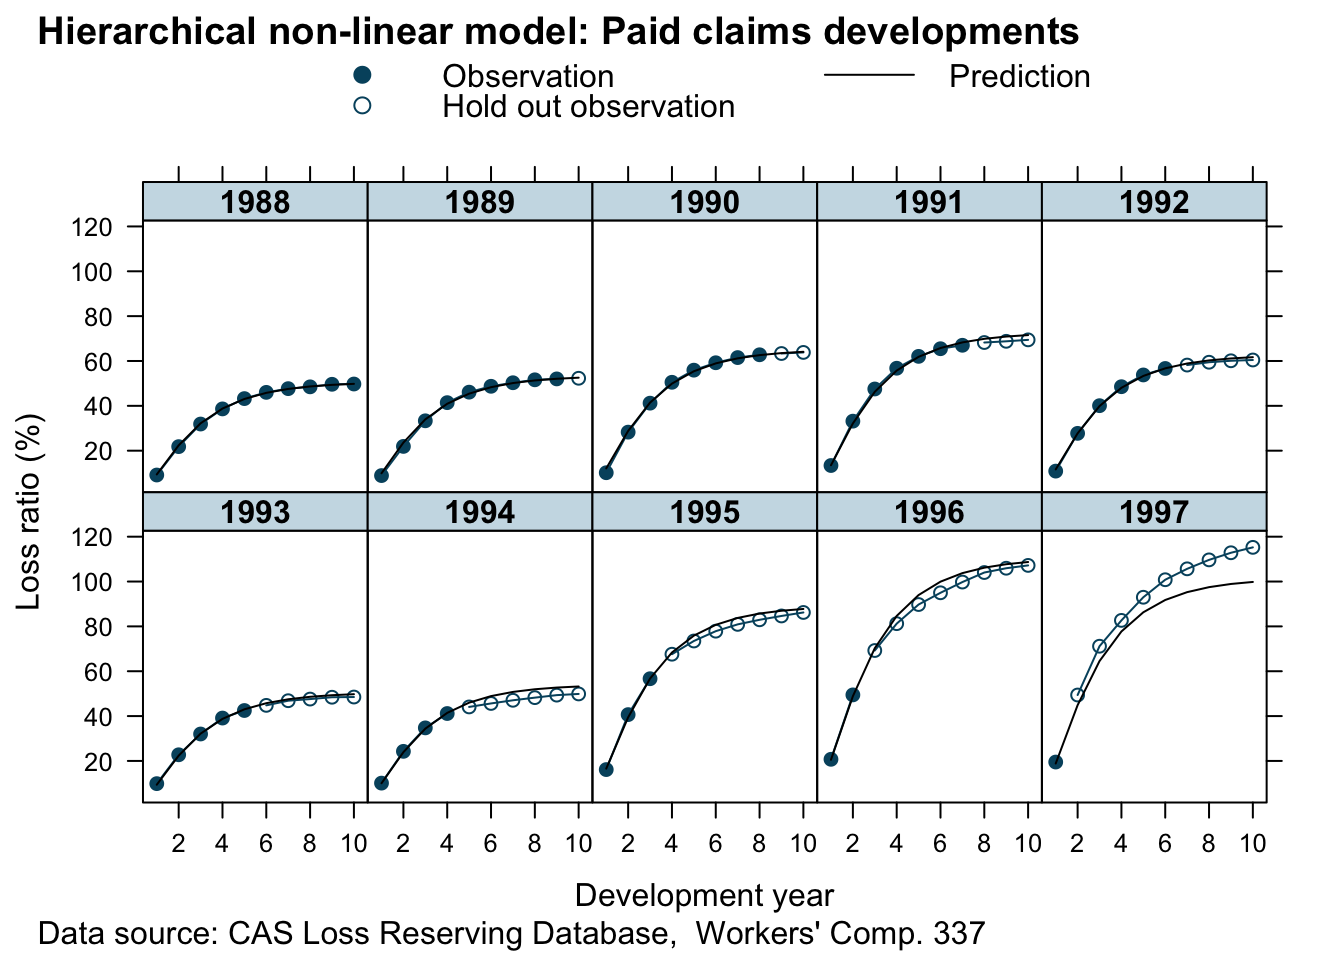
plotDevBananas(`Q2.5`/premium*100 + `Q97.5`/premium*100 +
                 Estimate/premium*100 + loss_train/premium*100 +
                 loss_test/premium*100 ~
                 dev | factor(accident_year), ylim=c(0, 120),
               data=cbind(lossData0, predClaimsPred)[delta==1],
               main="Paid claims developments",
               ylab="Paid loss ratio (%)")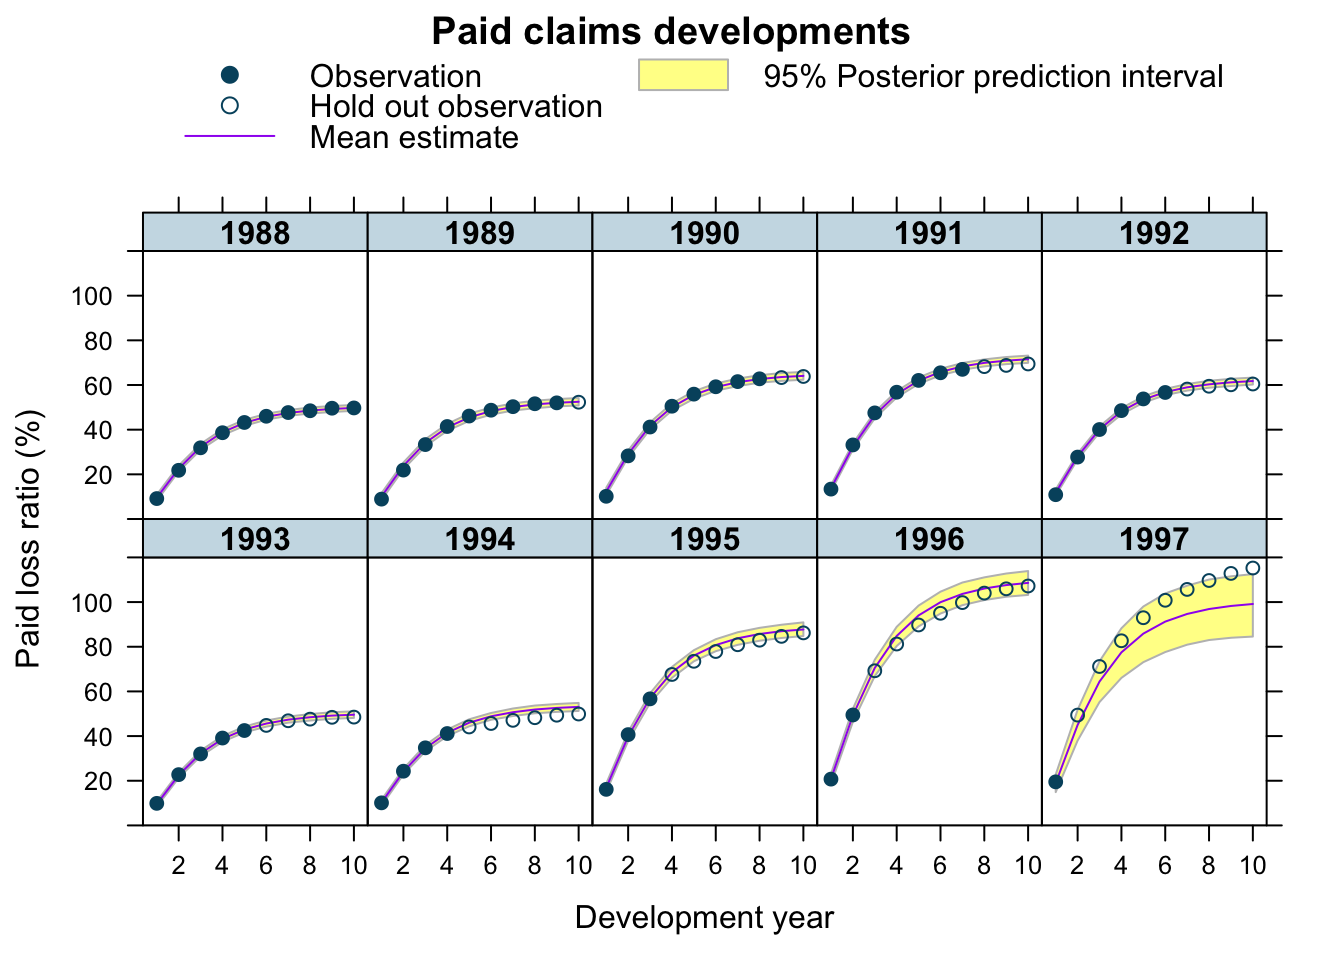
The output looks very promising, apart form the 1997 accident year, which turned out even worse than 1996. Perhaps, I shouldn’t assume a Gaussian data generating distribution, but a distribution which is skewed to the right, such as Gamma, Weibull or Log-normal, all of which is doable with brm by changing the family argument.
The under-prediction for 1997 may arise because historically RRF < 100% i.e. over-reserving. However, over-reserving lessens in more recent accident years as the reserving cycle kicks in, and the latest accident year in particular appears to exhibit under-reserving. With only 2 data points from which to assess this, shrinkage drags the RRF parameter downwards. It would be an interesting exercise to try and incorporate a prior which captures the expectation of a deteriotating reserving cycle.
Additionally, I could test for auto-correlation, calendar year effects, etc. Jake’s paper has further details on this, he also shows how the model can be extended to cover time-dependent parameters and covariate sub-models.
If you’d like to learn more about brms and compartmental reserving model attend the Stan workshop at Cass Business School London, following the Insurance Data Science conference, on 17 July 2018, where Paul and Jake will be there as well.
Update
Jake and I published a new research paper on Hierarchical Compartmental Reserving Models:

Gesmann, M., and Morris, J. “Hierarchical Compartmental Reserving Models.” Casualty Actuarial Society, CAS Research Papers, 19 Aug. 2020, https://www.casact.org/sites/default/files/2021-02/compartmental-reserving-models-gesmannmorris0820.pdf
Session Info
sessionInfo()## R version 4.0.3 (2020-10-10)
## Platform: x86_64-apple-darwin17.0 (64-bit)
## Running under: macOS Big Sur 10.16
##
## Matrix products: default
## BLAS: /Library/Frameworks/R.framework/Versions/4.0/Resources/lib/libRblas.dylib
## LAPACK: /Library/Frameworks/R.framework/Versions/4.0/Resources/lib/libRlapack.dylib
##
## locale:
## [1] en_GB.UTF-8/en_GB.UTF-8/en_GB.UTF-8/C/en_GB.UTF-8/en_GB.UTF-8
##
## attached base packages:
## [1] stats graphics grDevices utils datasets methods base
##
## other attached packages:
## [1] rstan_2.21.2 ggplot2_3.3.3 StanHeaders_2.21.0-7
## [4] nlme_3.1-151 latticeExtra_0.6-29 lattice_0.20-41
## [7] data.table_1.13.6 deSolve_1.28
##
## loaded via a namespace (and not attached):
## [1] minqa_1.2.4 colorspace_2.0-0 ellipsis_0.3.1
## [4] ggridges_0.5.2 brms_2.14.4 rsconnect_0.8.16
## [7] markdown_1.1 base64enc_0.1-3 DT_0.16
## [10] fansi_0.4.1 mvtnorm_1.1-1 codetools_0.2-18
## [13] bridgesampling_1.0-0 splines_4.0.3 knitr_1.30
## [16] shinythemes_1.1.2 bayesplot_1.7.2 projpred_2.0.2
## [19] jsonlite_1.7.2 nloptr_1.2.2.2 png_0.1-7
## [22] shiny_1.5.0 compiler_4.0.3 backports_1.2.1
## [25] assertthat_0.2.1 Matrix_1.3-0 fastmap_1.0.1
## [28] cli_2.2.0 later_1.1.0.1 htmltools_0.5.0
## [31] prettyunits_1.1.1 tools_4.0.3 igraph_1.2.6
## [34] coda_0.19-4 gtable_0.3.0 glue_1.4.2
## [37] reshape2_1.4.4 dplyr_1.0.2 V8_3.4.0
## [40] Rcpp_1.0.5 vctrs_0.3.6 blogdown_0.21
## [43] crosstalk_1.1.0.1 xfun_0.19 stringr_1.4.0
## [46] ps_1.5.0 lme4_1.1-26 mime_0.9
## [49] miniUI_0.1.1.1 lifecycle_0.2.0 gtools_3.8.2
## [52] statmod_1.4.35 MASS_7.3-53 zoo_1.8-8
## [55] scales_1.1.1 colourpicker_1.1.0 promises_1.1.1
## [58] Brobdingnag_1.2-6 parallel_4.0.3 inline_0.3.17
## [61] shinystan_2.5.0 RColorBrewer_1.1-2 gamm4_0.2-6
## [64] yaml_2.2.1 curl_4.3 gridExtra_2.3
## [67] loo_2.4.1 stringi_1.5.3 dygraphs_1.1.1.6
## [70] boot_1.3-25 pkgbuild_1.2.0 rlang_0.4.10
## [73] pkgconfig_2.0.3 matrixStats_0.57.0 evaluate_0.14
## [76] purrr_0.3.4 rstantools_2.1.1 htmlwidgets_1.5.3
## [79] tidyselect_1.1.0 processx_3.4.5 plyr_1.8.6
## [82] magrittr_2.0.1 bookdown_0.21 R6_2.5.0
## [85] generics_0.1.0 pillar_1.4.7 withr_2.3.0
## [88] mgcv_1.8-33 xts_0.12.1 abind_1.4-5
## [91] tibble_3.0.4 crayon_1.3.4 rmarkdown_2.6
## [94] jpeg_0.1-8.1 grid_4.0.3 callr_3.5.1
## [97] threejs_0.3.3 digest_0.6.27 xtable_1.8-4
## [100] httpuv_1.5.4 RcppParallel_5.0.2 stats4_4.0.3
## [103] munsell_0.5.0 shinyjs_2.0.0References
Citation
For attribution, please cite this work as:Markus Gesmann (Jan 09, 2018) Hierarchical compartmental reserving models. Retrieved from https://magesblog.com/post/hierarchical-compartmental-reserving-models/
@misc{ 2018-hierarchical-compartmental-reserving-models,
author = { Markus Gesmann },
title = { Hierarchical compartmental reserving models },
url = { https://magesblog.com/post/hierarchical-compartmental-reserving-models/ },
year = { 2018 }
updated = { Jan 09, 2018 }
}