ChainLadder 0.2.2 is out with improved glmReserve function
We released version 0.2.2 of ChainLadder a few weeks ago. This version adds back the functionality to estimate the index parameter for the compound Poisson model in glmReserve using the cplm package by Wayne Zhang.
Ok, what does this all mean? I will run through a couple of examples and look behind the scene of glmReserve. However, the clue is in the title, glmReserve is a function that uses a generalised linear model to estimate future claims, assuming claims follow a Tweedie distribution. I should actually talk about a family of distributions that is known as Tweedie, named by Bent Jørgensen after Maurice Tweedie. Joe Rickert published a nice post about the Tweedie distribution last year.
Like most other functions in ChainLadder, glmReserve purpose is to predict future insurance claims based on historical data.
The data at hand is often presented in form of a claims triangle, such as the following example data set from the ChainLadder package:
library(ChainLadder)
cum2incr(UKMotor)
##       dev
## origin    1    2    3    4    5   6   7
##   2007 3511 3215 2266 1712 1059 587 340
##   2008 4001 3702 2278 1180  956 629  NA
##   2009 4355 3932 1946 1522 1238  NA  NA
##   2010 4295 3455 2023 1320   NA  NA  NA
##   2011 4150 3747 2320   NA   NA  NA  NA
##   2012 5102 4548   NA   NA   NA  NA  NA
##   2013 6283   NA   NA   NA   NA  NA  NA
The rows present different origin periods in which accidents occurred and the columns along each row show the incremental reported claims over the years (the data itself is stored in a cumulative form).
Suppose all claims will be reported within 7 years, then I’d like to know how much money should be set aside for the origin years 2008 to 2013 for claims that have incurred but not been reported (IBNR) yet. Or, to put it differently, I have to predict the NA fields in the bottom right hand triangle.
First, let’s reformat the data as it would be stored in a database, that is in a long format of incremental claims over the years (I add the years also as factors, which I will use later):
claims <- as.data.frame(cum2incr(UKMotor)) # convert into long format
library(data.table)
claims <- data.table(claims)
claims <- claims[ , ':='(cal=origin+dev-1, # calendar period
                         originf=factor(origin),
                         devf=factor(dev))]
claims <- claims[order(dev), cum.value:=cumsum(value), by=origin]
setnames(claims, "value", "inc.value")
head(claims)
##    origin dev inc.value  cal originf devf cum.value
## 1:   2007   1      3511 2007    2007    1      3511
## 2:   2008   1      4001 2008    2008    1      4001
## 3:   2009   1      4355 2009    2009    1      4355
## 4:   2010   1      4295 2010    2010    1      4295
## 5:   2011   1      4150 2011    2011    1      4150
## 6:   2012   1      5102 2012    2012    1      5102
Let’s visualise the data:
library(lattice)
xyplot(cum.value/1000 + log(inc.value) ~ dev , groups=origin, data=claims,
       t="b", par.settings = simpleTheme(pch = 16),
       auto.key = list(space="right",
                       title="Origin\nperiod", cex.title=1,
                       points=FALSE, lines=TRUE, type="b"),
       xlab="Development period", ylab="Amount",
       main="Claims development by origin period",
       scales="free")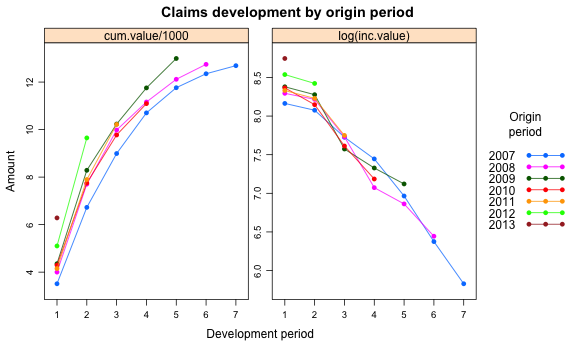
The left plot of the chart above shows the cumulative claims payment over time, while the right plot shows the log-transformed incremental claims development for each origin/accident year.
One of the oldest methods to predict future claims development is called chain-ladder, which can be regarded as a weighted linear regression through the origin of cumulative claims over the development periods. Multiplying those development factors to the latest available cumulative position allows me to predict future claims in an iterative fashion.
It is well know in actuarial science that a Poisson GLM produces the same forecasts as the chain-ladder model.
Let’s check:
# Poisson model
mdl.pois <- glm(inc.value ~ originf + devf, data=na.omit(claims),
                family=poisson(link = "log"))
# predict claims
claims <- claims[, ':='(
  pred.inc.value=predict(mdl.pois,
                         .SD[, list(originf, devf, inc.value)],
                         type="response")), by=list(originf, devf)]
# sum of future payments
claims[cal>max(origin)][, sum(pred.inc.value)]
## [1] 28655.77
# Chain-ladder forecast
summary(MackChainLadder(UKMotor, est.sigma = "Mack"))$Totals[4,]
## [1] 28655.77
Ok, this worked. However, both of these models make actually fairly strong assumptions. The Poisson model by its very nature will only produce whole numbers, and although payments could be regarded as whole numbers, say in pence or cents, it does feel a little odd to me. Similarly, modelling the year on year developments via a weighted linear regression through the origin, as in the case of the chain-ladder model, sounds not intuitive either.
There is another aspect to highlight with the Poisson model; its variance is equal to the mean. Yet, in real data I often observe that the variance increases in proportion to the mean. Well, this can be remedied by using an over-dispersed quasi-Poisson model.
I think a more natural approach would be to assume a compound distribution that models the frequency and severity of claims separately, e.g. Poisson frequency and Gamma severity.
Here the Tweedie distributions comes into play.
Tweedie distributions are a subset of what are called Exponential Dispersion Models. EDMs are two parameter distributions from the linear exponential family that also have a dispersion parameter \(\Phi\).
Furthermore, the variance is a power function of the mean, i.e. \(\mbox{Var}(X)=\Phi \, E[X]^p\).
The canonical link function for a Tweedie distribution in a GLM is the power link \(\mu^q\) with \(q=1-p\). Note, \(q=0\) is interpreted as \(\log(\mu)\).
Thus, let \(\mu_i = E(y_i)\) be the expectation of the ith response. Then I have the following model. \[ \begin{aligned} y & \sim \mbox{Tweedie}(q, p)\\ E(y) & = \mu^q = Xb \\ \mbox{Var}(y) & = \Phi \mu^p \end{aligned} \] The variance power \(p\) characterises the distribution of the responses \(y\). The following are some special cases:
- Normal distribution, p = 0
- Poisson distribution, p = 1
- Compound Poisson-Gamma distribution, 1 < p < 2
- Gamma distribution, p = 2
- Inverse-Gaussian, p = 3
- Stable, with support on the positive real numbers, p > 2
Finally, I get back to the glmReserve function, which Wayne Zhang, the other author of the cplm package, contributed to the ChainLadder package.
With glmReserve I can model a claims triangle using the Tweedie distribution family.
In my first example I set use the parameters \(p=1, q=0\), which should return the results of the Poisson model.
(m1 <- glmReserve(UKMotor, var.power = 1, link.power = 0))
##       Latest Dev.To.Date Ultimate  IBNR       S.E         CV
## 2008   12746   0.9732000    13097   351  125.8106 0.35843464
## 2009   12993   0.9260210    14031  1038  205.0826 0.19757473
## 2010   11093   0.8443446    13138  2045  278.8519 0.13635790
## 2011   10217   0.7360951    13880  3663  386.7919 0.10559429
## 2012    9650   0.5739948    16812  7162  605.2741 0.08451188
## 2013    6283   0.3038201    20680 14397 1158.1250 0.08044210
## total  62982   0.6872913    91638 28656 1708.1963 0.05961042
Perfect, I get the same results, plus further information about the model.
Setting the argument var.power=NULL will estimate \(p\) in the interval \((1,2)\) using the cplm package.
(m2 <- glmReserve(UKMotor, var.power=NULL))
##       Latest Dev.To.Date Ultimate  IBNR       S.E         CV
## 2008   12746   0.9732000    13097   351  110.0539 0.31354394
## 2009   12993   0.9260870    14030  1037  176.9361 0.17062307
## 2010   11093   0.8444089    13137  2044  238.5318 0.11669851
## 2011   10217   0.7360951    13880  3663  335.6824 0.09164138
## 2012    9650   0.5739948    16812  7162  543.6472 0.07590718
## 2013    6283   0.3038201    20680 14397 1098.7988 0.07632138
## total  62982   0.6873063    91636 28654 1622.4616 0.05662252
m2$model
##
## Call:
## cpglm(formula = value ~ factor(origin) + factor(dev), link = link.power,
##     data = ldaFit, offset = offset)
##
## Deviance Residuals:
##     Min       1Q   Median       3Q      Max
## -6.7901  -1.6969   0.0346   1.6087   8.4465
##                    Estimate Std. Error t value Pr(>|t|)
## (Intercept)         8.25763    0.04954 166.680  < 2e-16 ***
## factor(origin)2008  0.03098    0.05874   0.527 0.605588
## factor(origin)2009  0.09999    0.05886   1.699 0.110018
## factor(origin)2010  0.03413    0.06172   0.553 0.588369
## factor(origin)2011  0.08933    0.06365   1.403 0.180876
## factor(origin)2012  0.28091    0.06564   4.279 0.000659 ***
## factor(origin)2013  0.48797    0.07702   6.336 1.34e-05 ***
## factor(dev)2       -0.11740    0.04264  -2.753 0.014790 *
## factor(dev)3       -0.62829    0.05446 -11.538 7.38e-09 ***
## factor(dev)4       -1.03168    0.06957 -14.830 2.28e-10 ***
## factor(dev)5       -1.31346    0.08857 -14.829 2.28e-10 ***
## factor(dev)6       -1.86307    0.13826 -13.475 8.73e-10 ***
## factor(dev)7       -2.42868    0.25468  -9.536 9.30e-08 ***
## ---
## Signif. codes:  0 '***' 0.001 '**' 0.01 '*' 0.05 '.' 0.1 ' ' 1
##
## Estimated dispersion parameter: 10.788
## Estimated index parameter: 1.01
##
## Residual deviance: 299.27  on 15  degrees of freedom
## AIC:  389.18
##
## Number of Fisher Scoring iterations:  4
From the model I note that the dispersion parameter \(\phi\) was estimated as 10.788 and the index parameter \(p\) as 1.01.
Not surprisingly the estimated reserves are similar to the Poisson model, but with a smaller predicted standard error.
Intuitively the modelling approach makes a lot more sense, but I end up with one parameter for each origin and development period, hence there is a danger of over-parametrisation.
Looking at the plots above again I note that many origin periods have a very similar development. Perhaps a hierarchical model would be more appropriate?
For more details onglmReserve see the help file and package vignette.Session Info
R version 3.2.2 (2015-08-14)
Platform: x86_64-apple-darwin13.4.0 (64-bit)
Running under: OS X 10.10.5 (Yosemite)

locale:
[1] en_GB.UTF-8/en_GB.UTF-8/en_GB.UTF-8/C/en_GB.UTF-8/en_GB.UTF-8

attached base packages:
[1] stats     graphics  grDevices utils     datasets  methods   base

other attached packages:
[1] data.table_1.9.6  ChainLadder_0.2.2

loaded via a namespace (and not attached):
 [1] Rcpp_0.12.1        nloptr_1.0.4       plyr_1.8.3
 [4] tools_3.2.2        digest_0.6.8       lme4_1.1-9
 [7] statmod_1.4.21     gtable_0.1.2       nlme_3.1-121
[10] lattice_0.20-33    mgcv_1.8-7         Matrix_1.2-2
[13] parallel_3.2.2     biglm_0.9-1        SparseM_1.7
[16] proto_0.3-10       coda_0.17-1        stringr_1.0.0
[19] MatrixModels_0.4-1 stats4_3.2.2       lmtest_0.9-34
[22] grid_3.2.2         nnet_7.3-10        tweedie_2.2.1
[25] cplm_0.7-4         minqa_1.2.4        ggplot2_1.0.1
[28] reshape2_1.4.1     car_2.1-0          actuar_1.1-10
[31] magrittr_1.5       scales_0.3.0       MASS_7.3-44
[34] splines_3.2.2      systemfit_1.1-18   pbkrtest_0.4-2
[37] colorspace_1.2-6   quantreg_5.19      sandwich_2.3-4
[40] stringi_0.5-5      munsell_0.4.2      chron_2.3-47
[43] zoo_1.7-12
Citation
For attribution, please cite this work as:Markus Gesmann (Sep 29, 2015) ChainLadder 0.2.2 is out with improved glmReserve function. Retrieved from https://magesblog.com/post/2015-09-29-chainladder-022-is-out-with-improved/
@misc{ 2015-chainladder-0.2.2-is-out-with-improved-glmreserve-function,
author = { Markus Gesmann },
title = { ChainLadder 0.2.2 is out with improved glmReserve function },
url = { https://magesblog.com/post/2015-09-29-chainladder-022-is-out-with-improved/ },
year = { 2015 }
updated = { Sep 29, 2015 }
}