googleVis 0.5.3 released
Recently we released googleVis 0.5.3 on CRAN. The package provides an interface between R and Google Charts, allowing you to create interactive web charts from R.
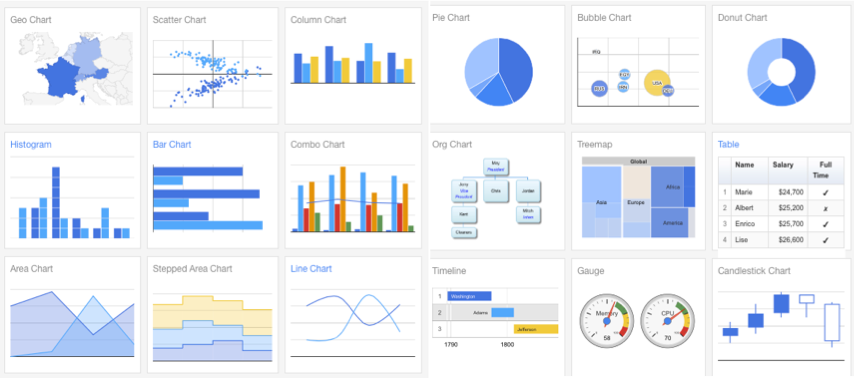 |
| Screen shot of some of the Google Charts |
- Default chart width is set to ‘automatic’ instead of 500 pixels.
- Intervals for columns roles have to end with the suffix “.i”, with “i” being an integer. Several interval columns are allowed, see the roles demo and vignette for more details.
- The order of y-variables in core charts wasn’t maintained. Thanks to John Taveras for reporting this bug.
- Width and height of googleVis charts were only accepted in pixels, although the Google Charts API uses standard HTML units (for example, ‘100px’, ‘80em’, ‘60’, ‘automatic’). If no units are specified the number is assumed to be pixels. This has been fixed. Thanks to Paul Murrell for reporting this issue.
New to googleVis? Review the demo on CRAN.
Citation
For attribution, please cite this work as:Markus Gesmann (Jul 08, 2014) googleVis 0.5.3 released. Retrieved from https://magesblog.com/post/2014-07-08-googlevis-053-released/
@misc{ 2014-googlevis-0.5.3-released,
author = { Markus Gesmann },
title = { googleVis 0.5.3 released },
url = { https://magesblog.com/post/2014-07-08-googlevis-053-released/ },
year = { 2014 }
updated = { Jul 08, 2014 }
}